Data visualization
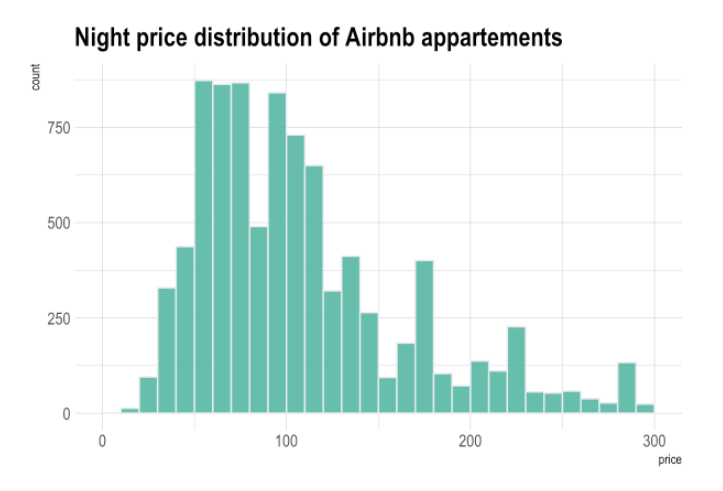
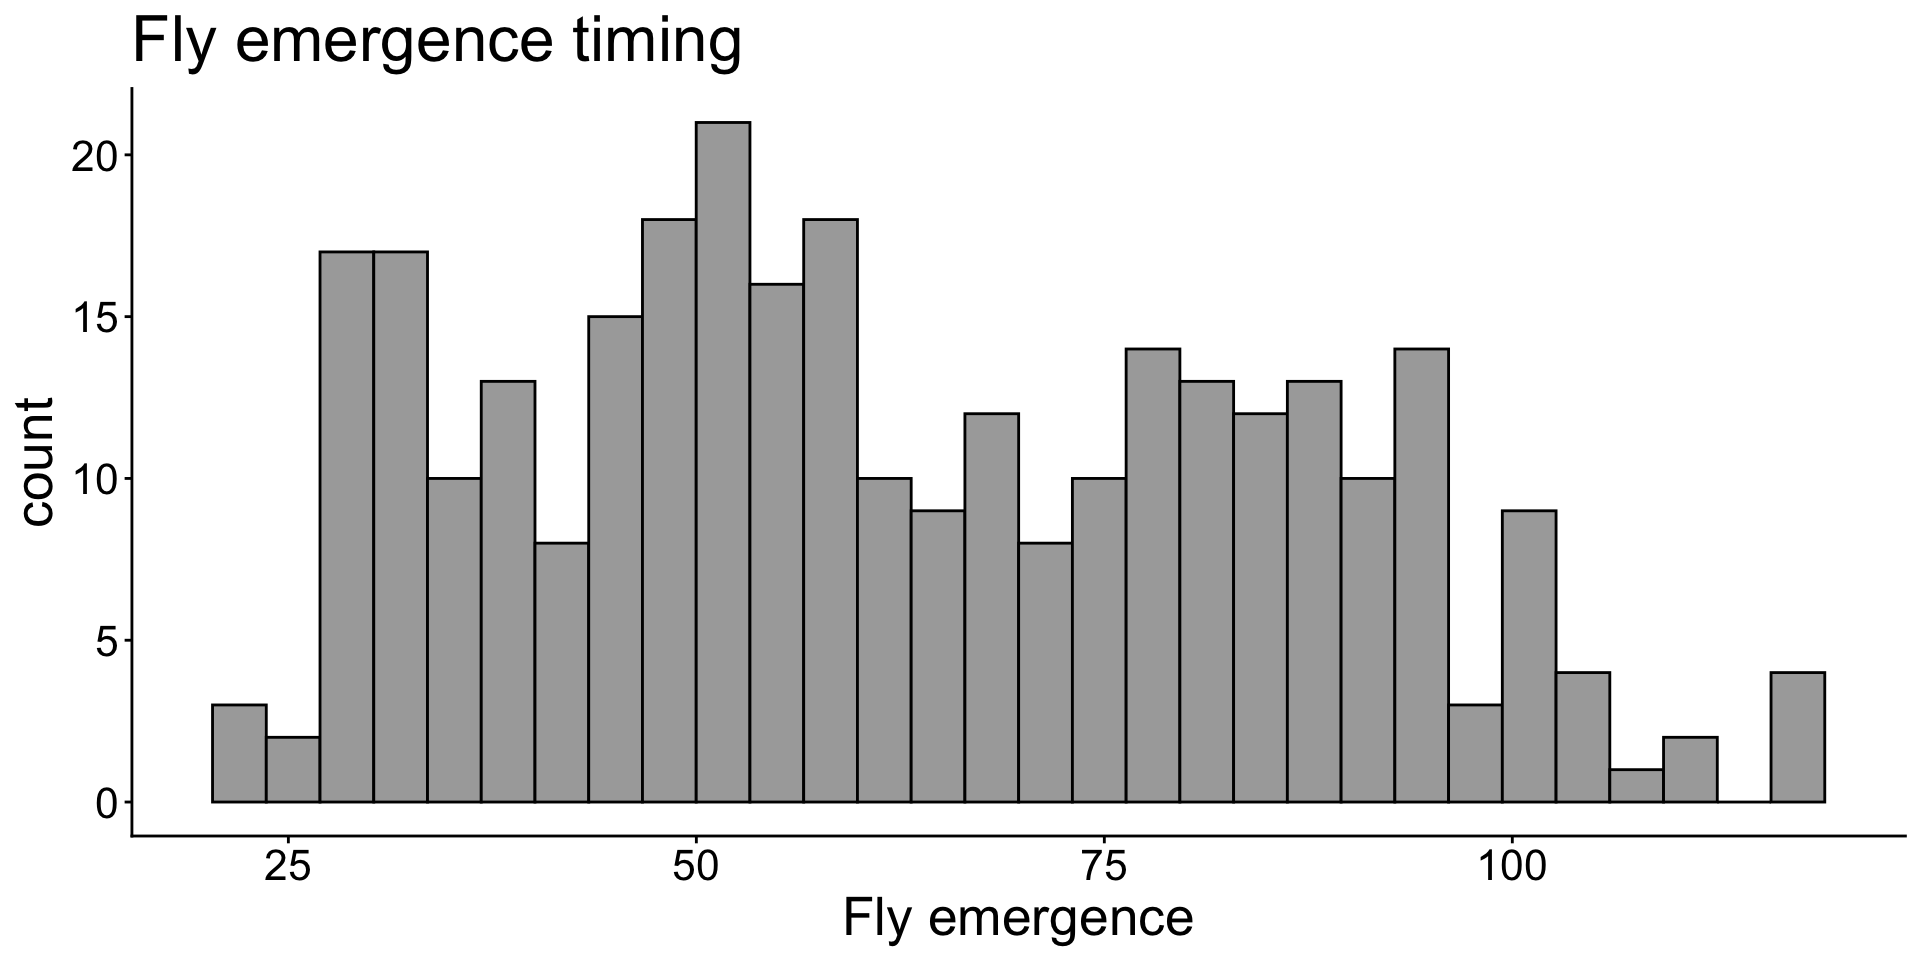
Histograms
Histograms show the distribution of data.
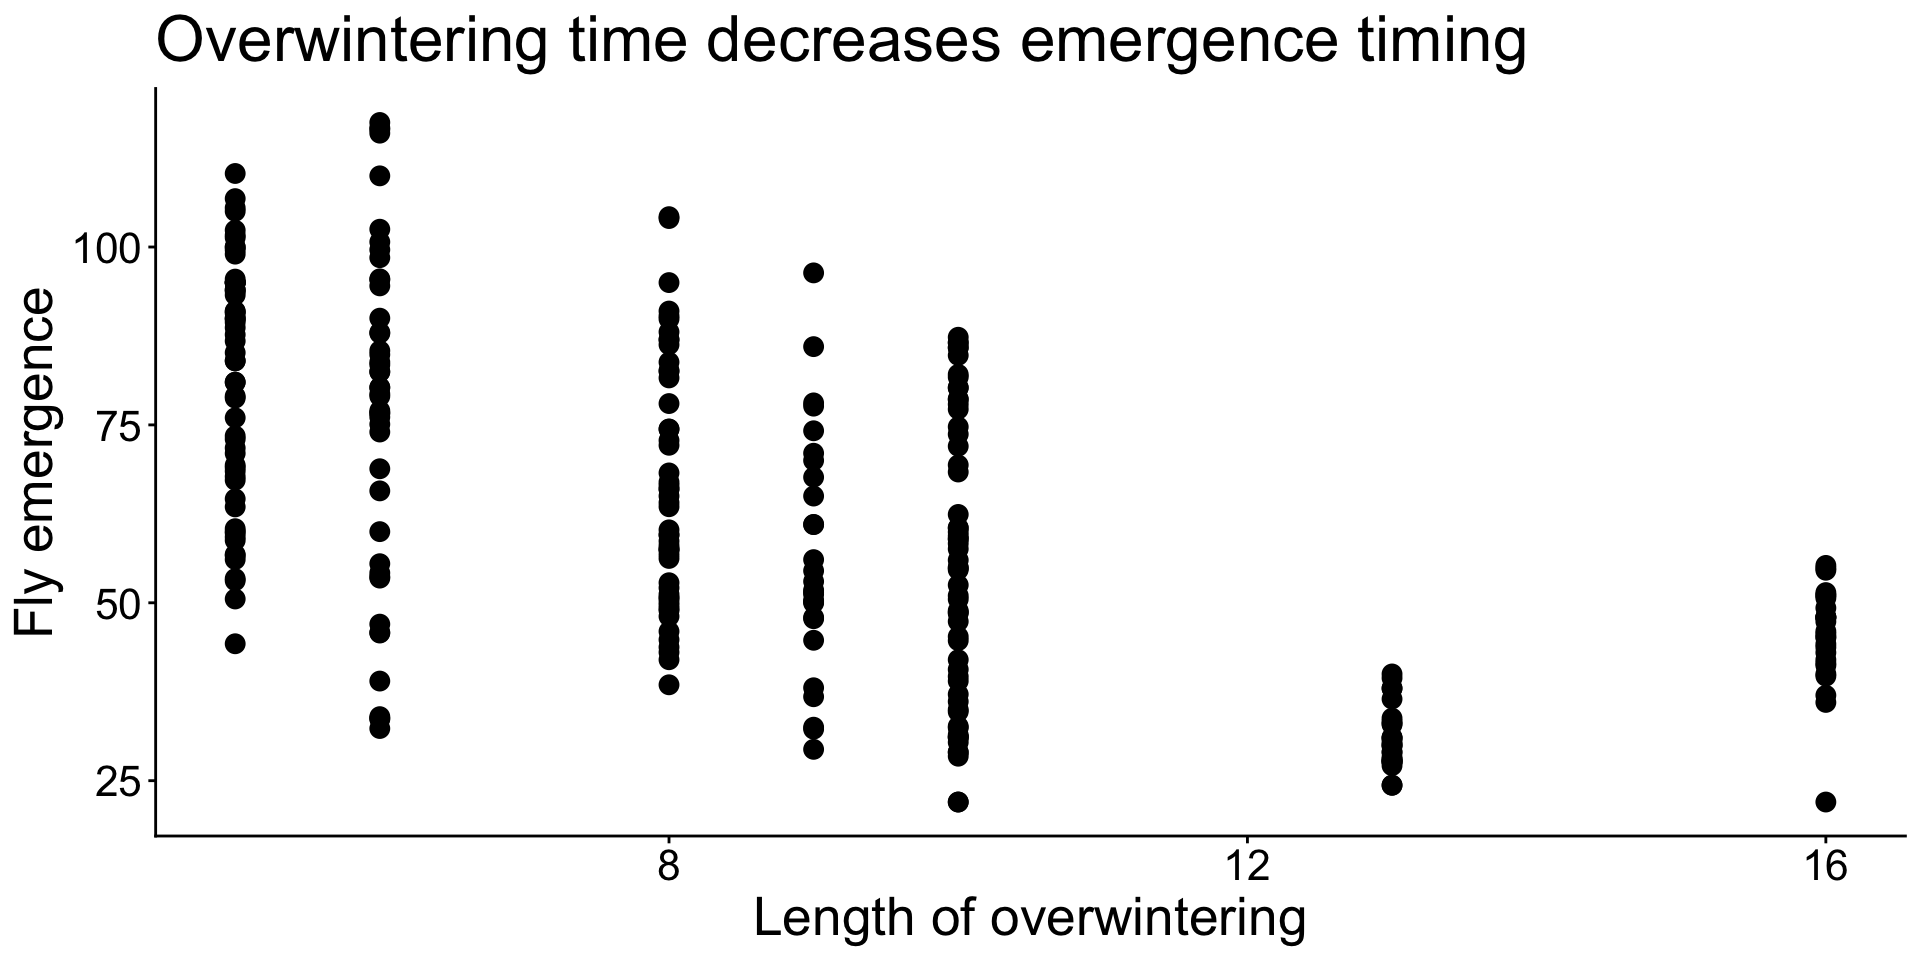
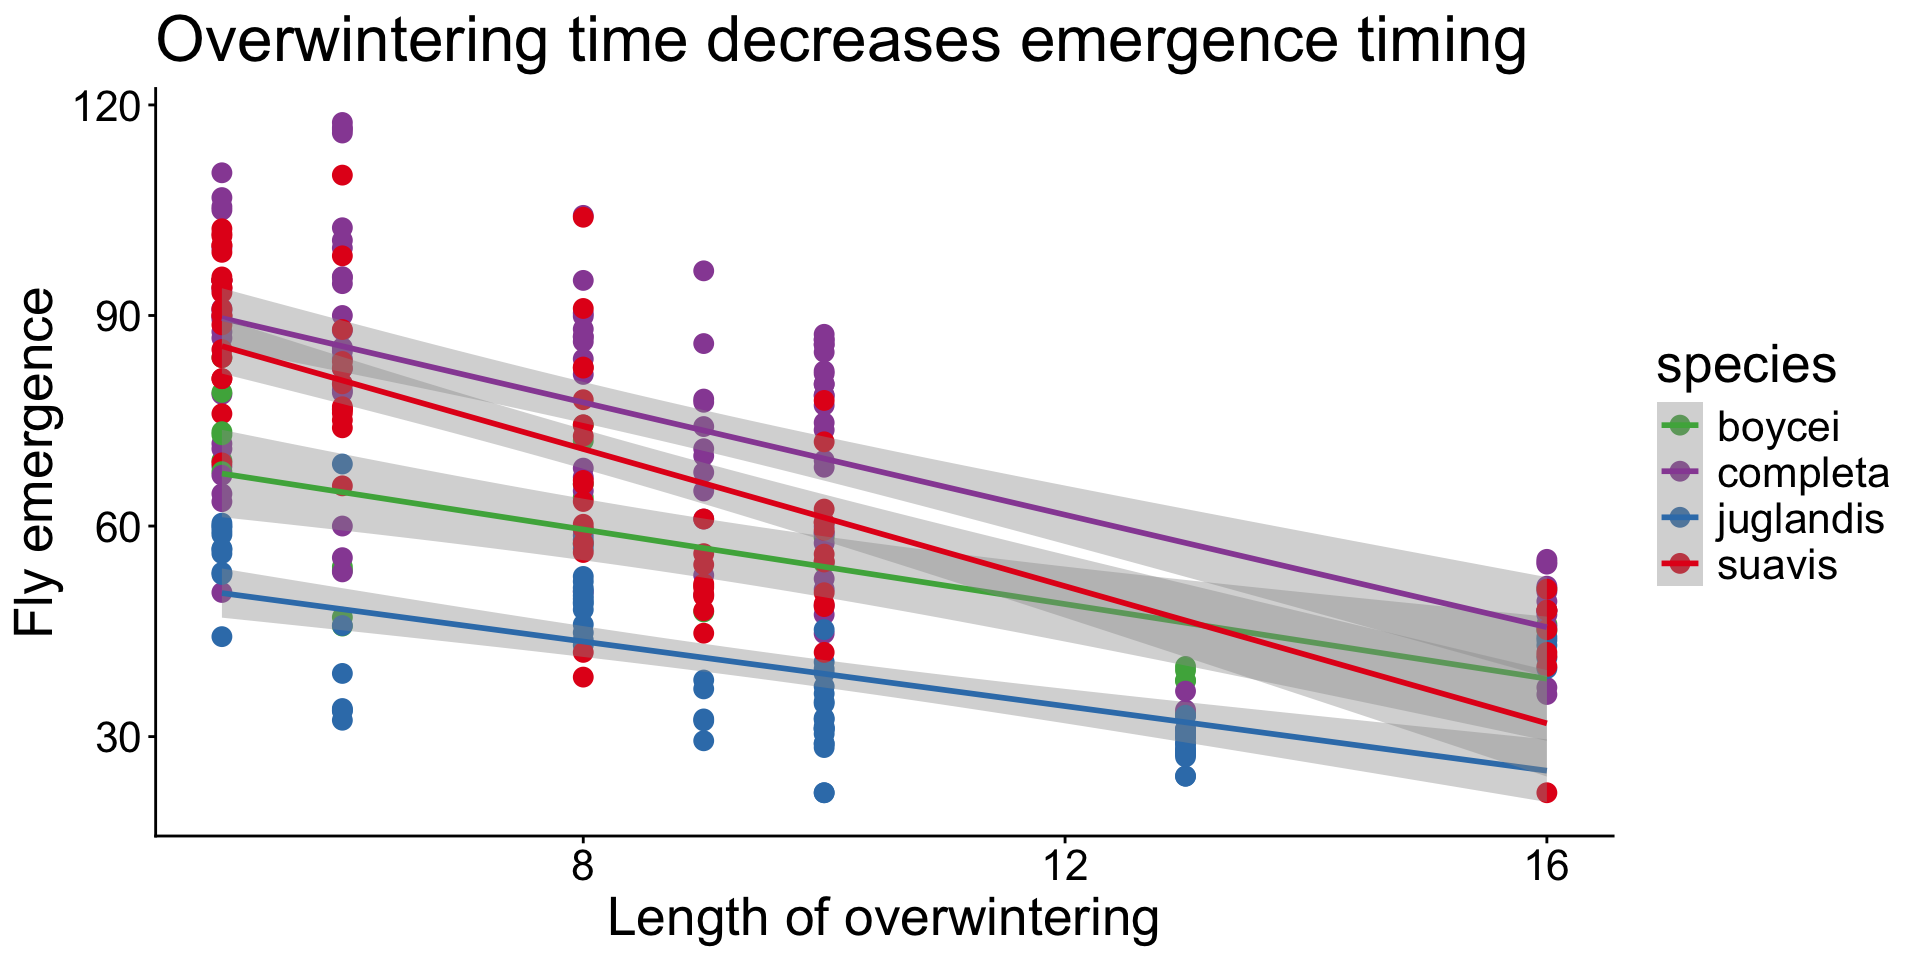
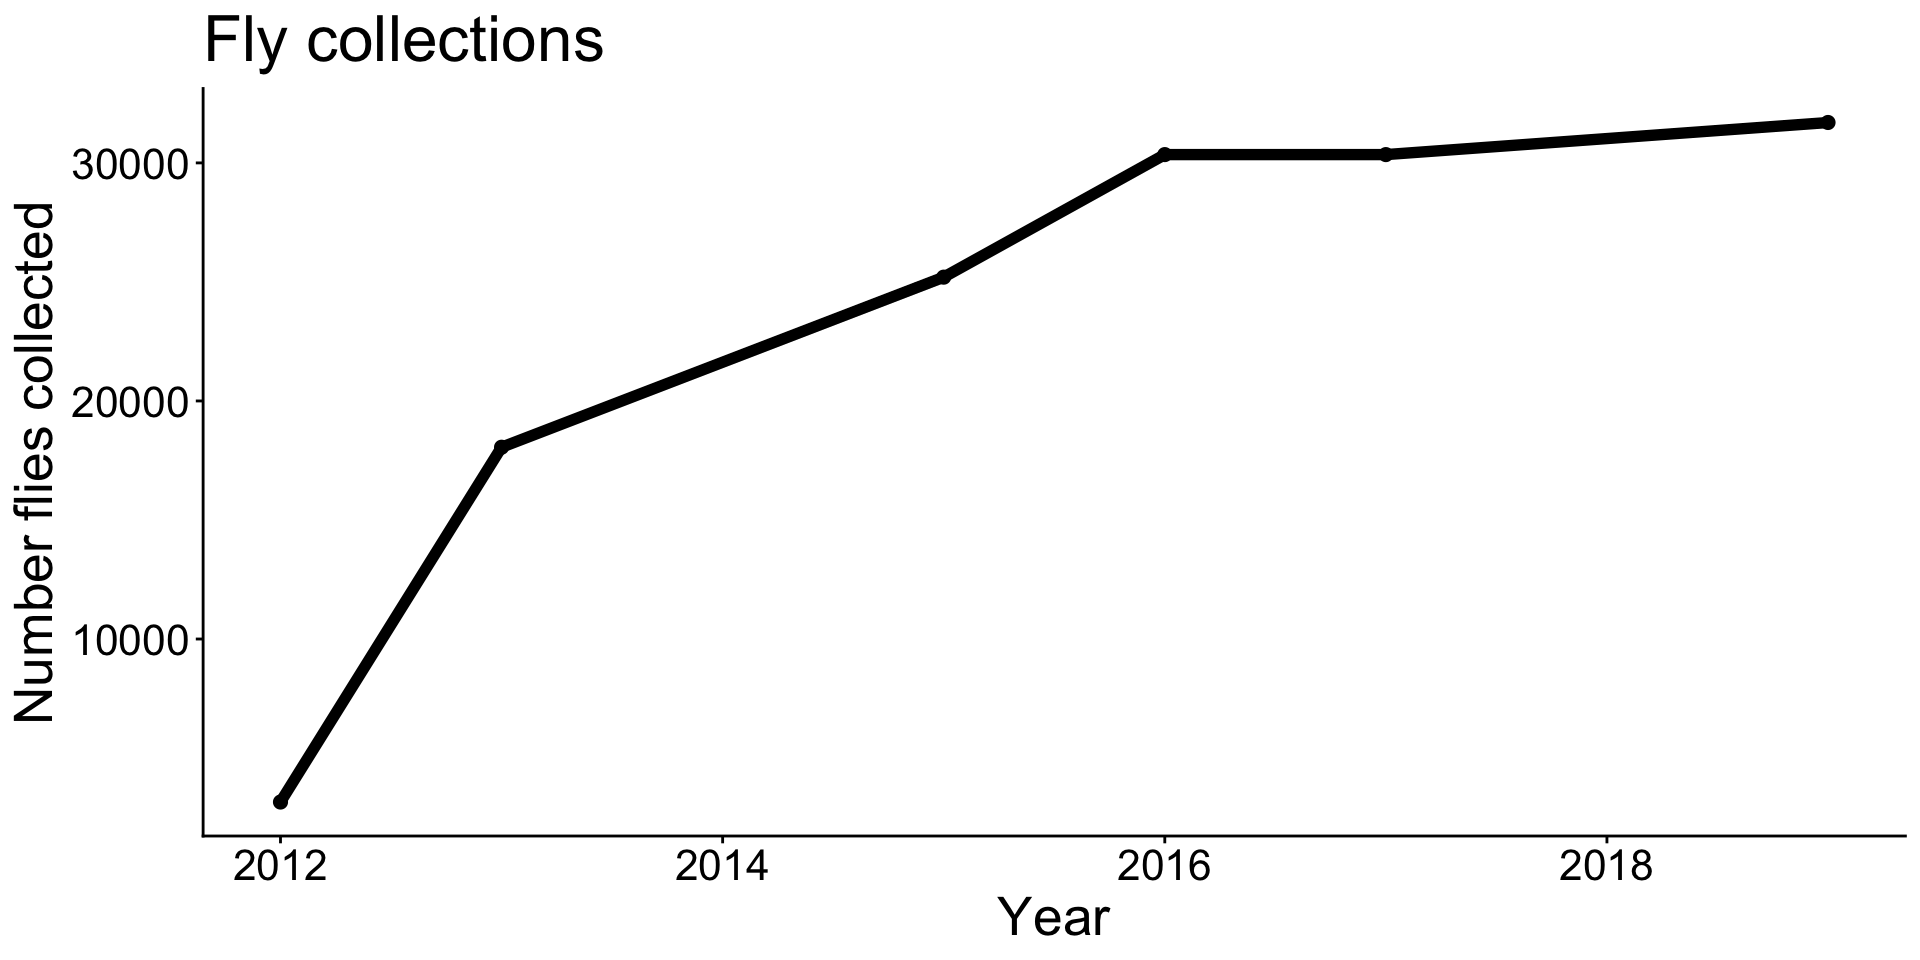
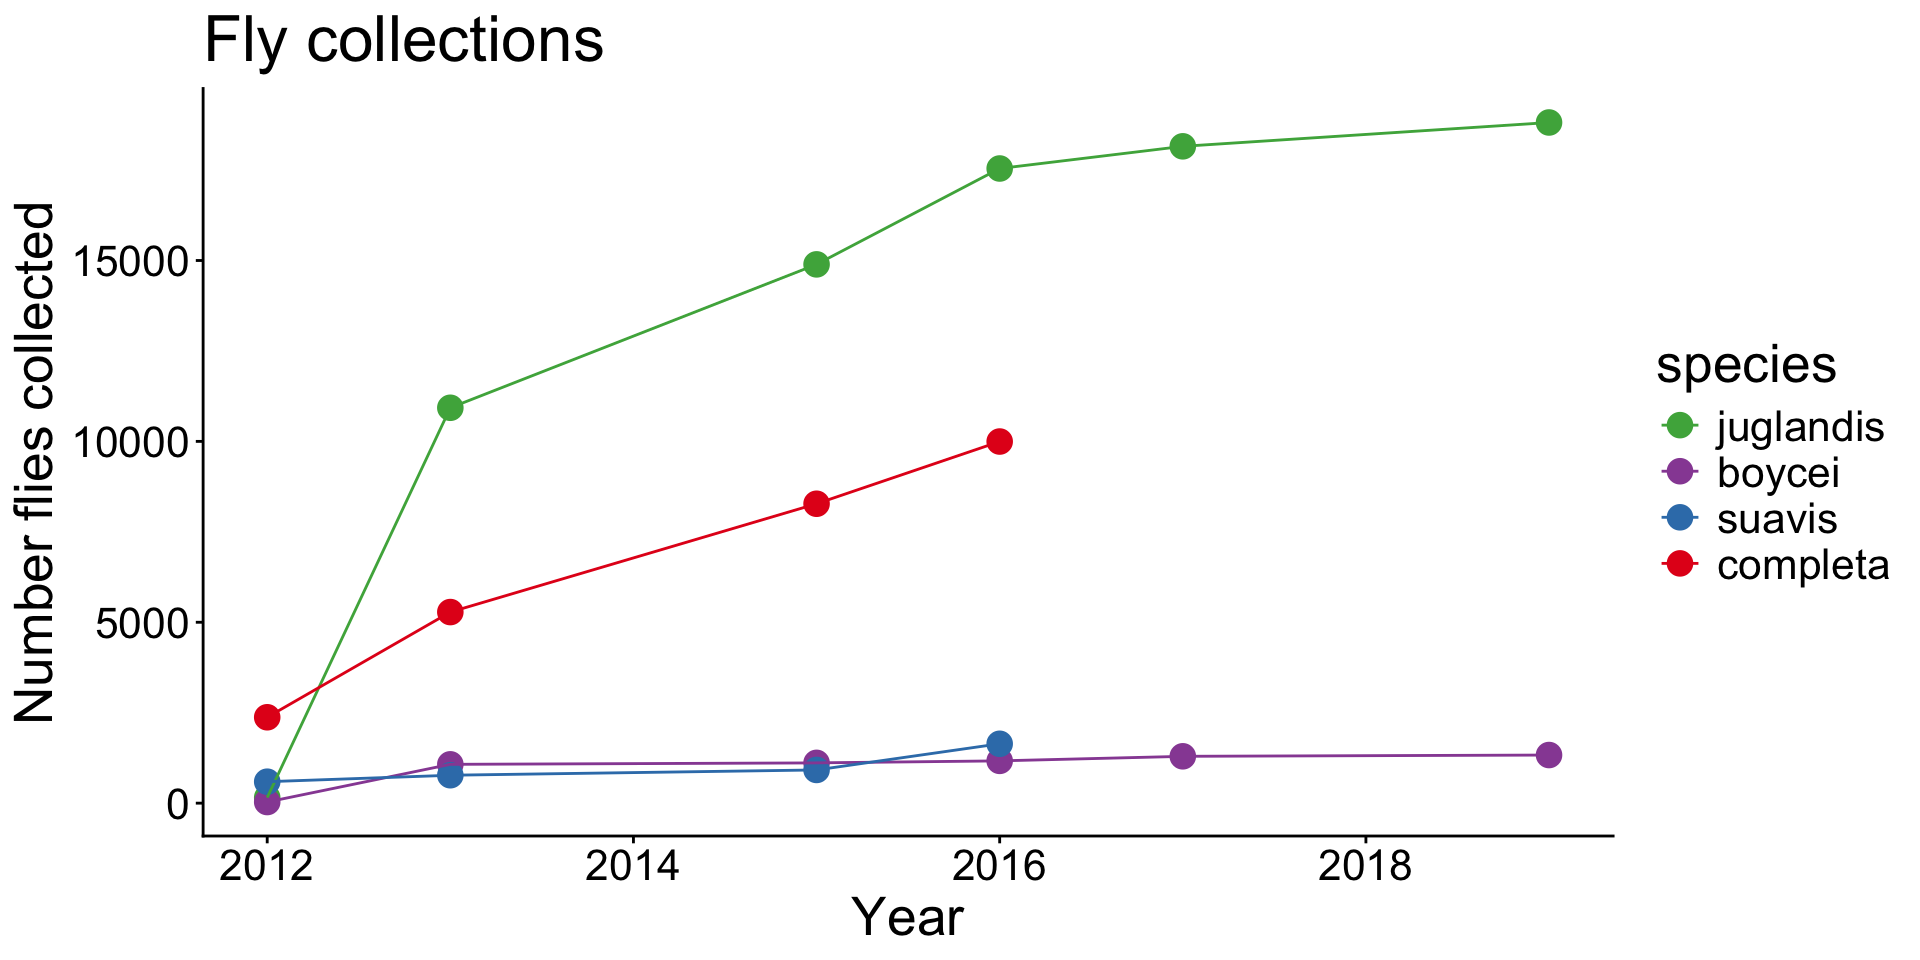
Scatterplots or dot plots are used with two numeric variables
Scatterplots are good for viewing relationships or correlations between variables.
Add trend line
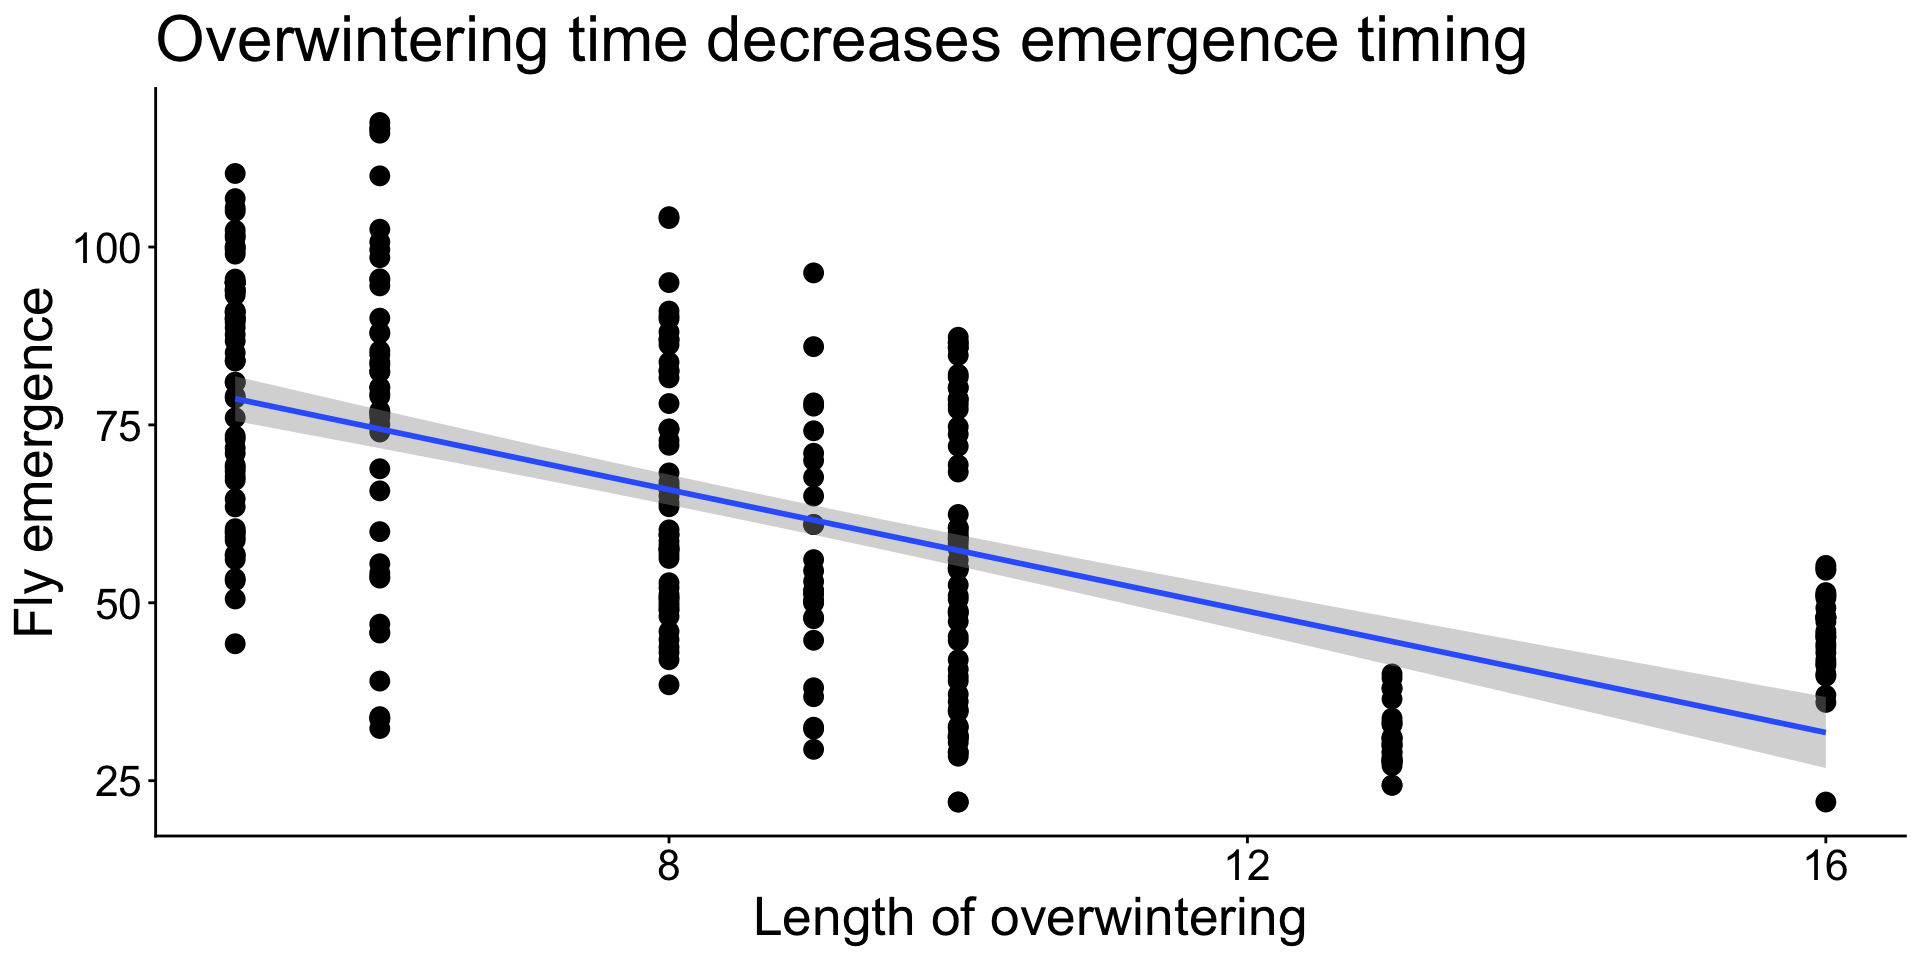
Add trend line
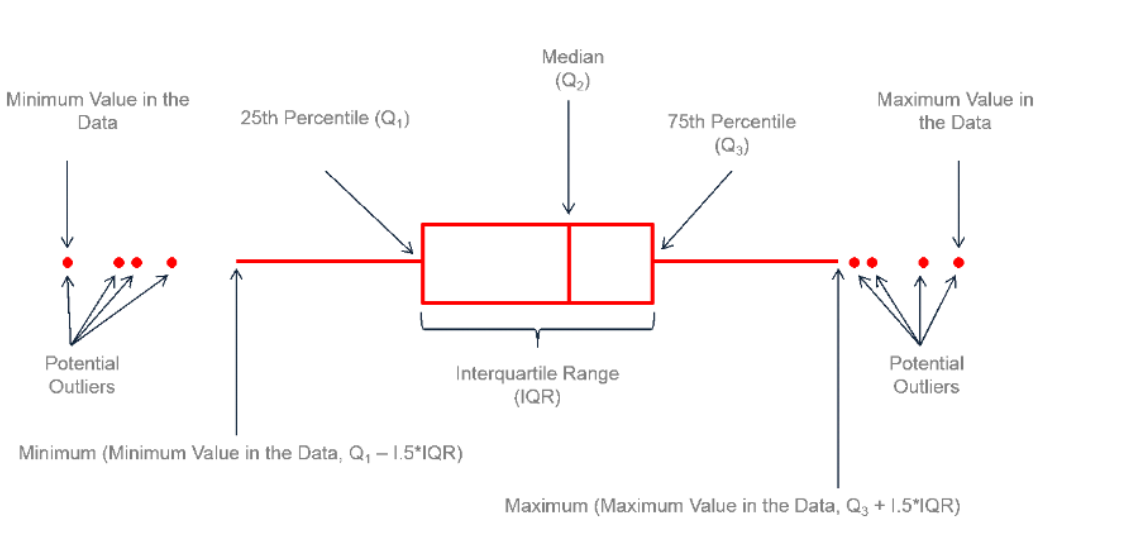
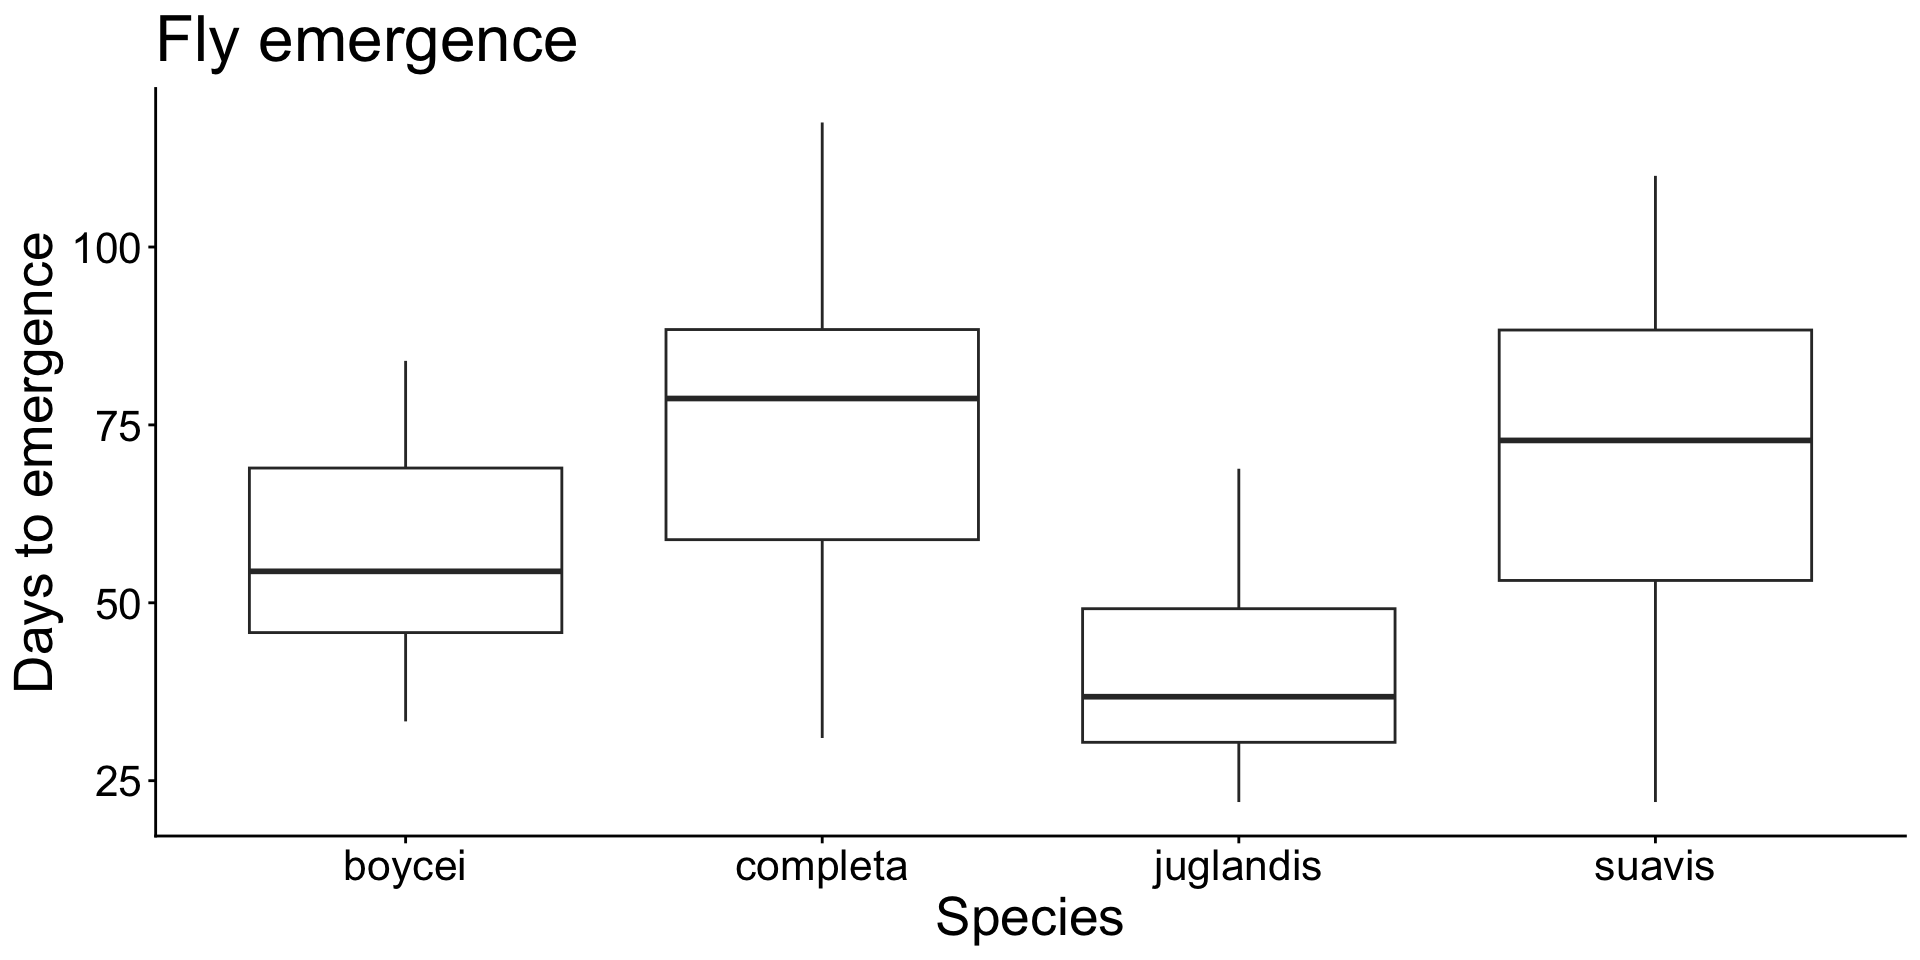
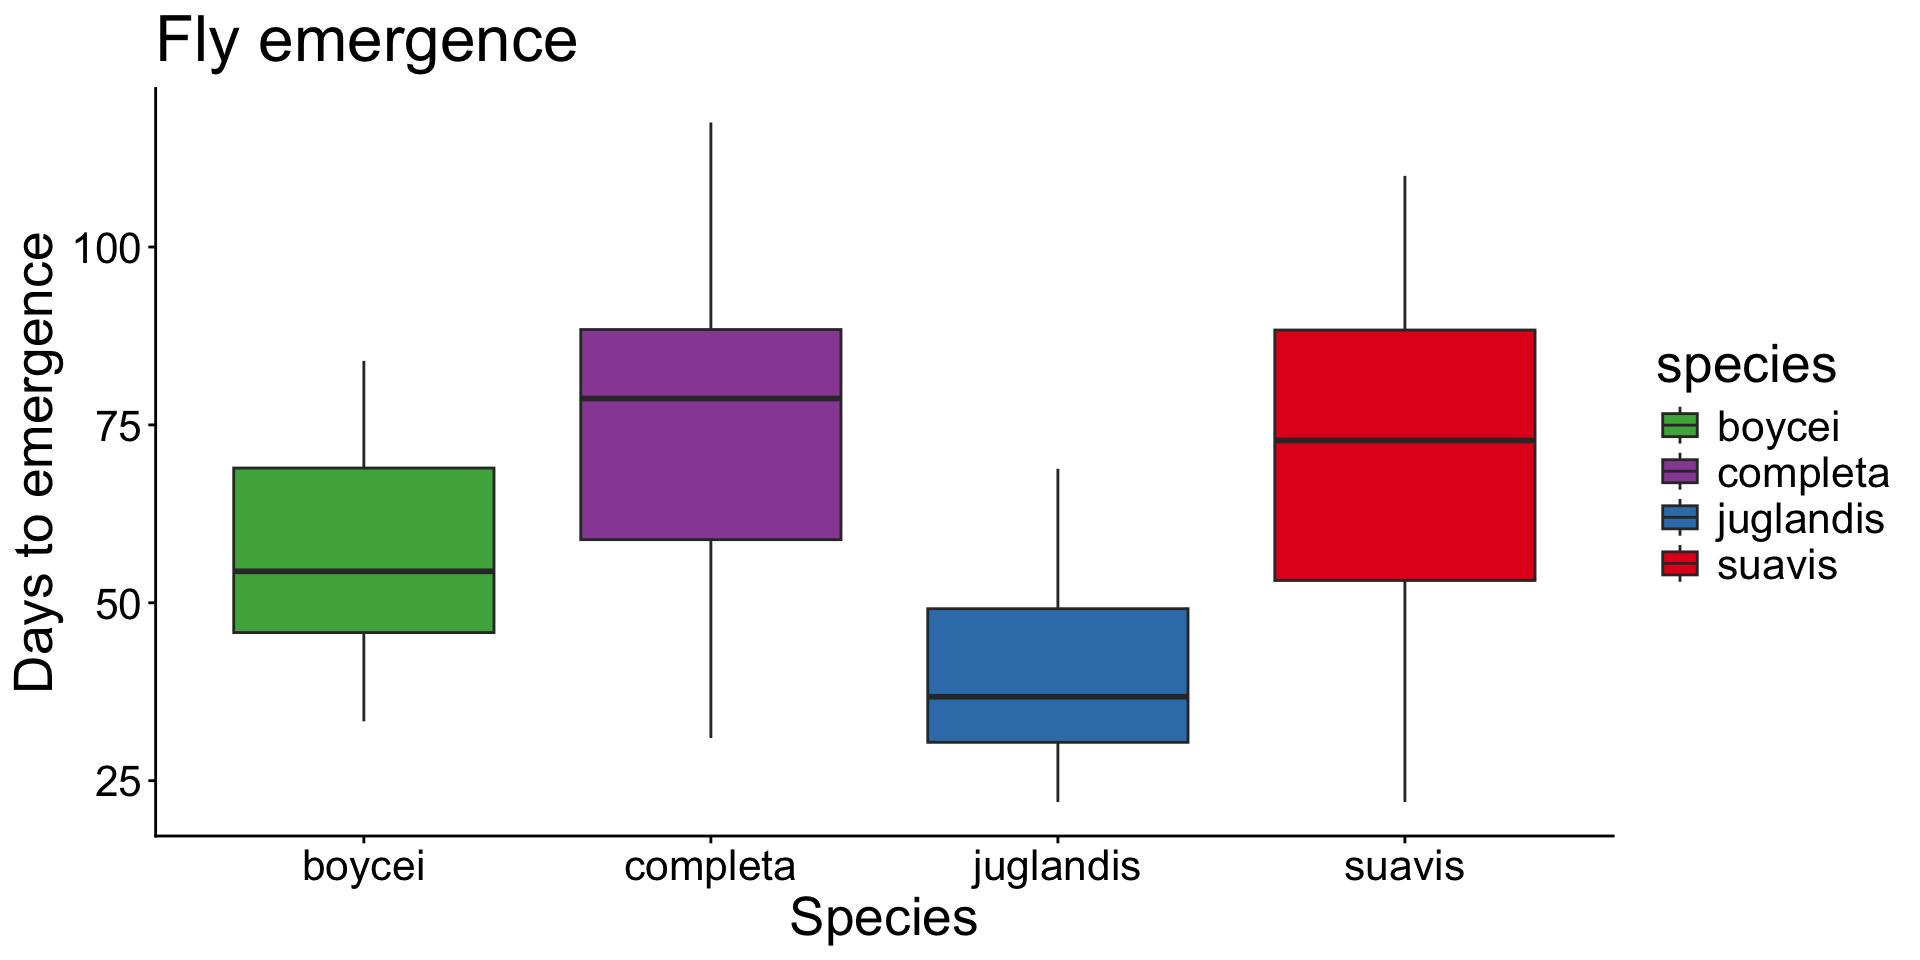
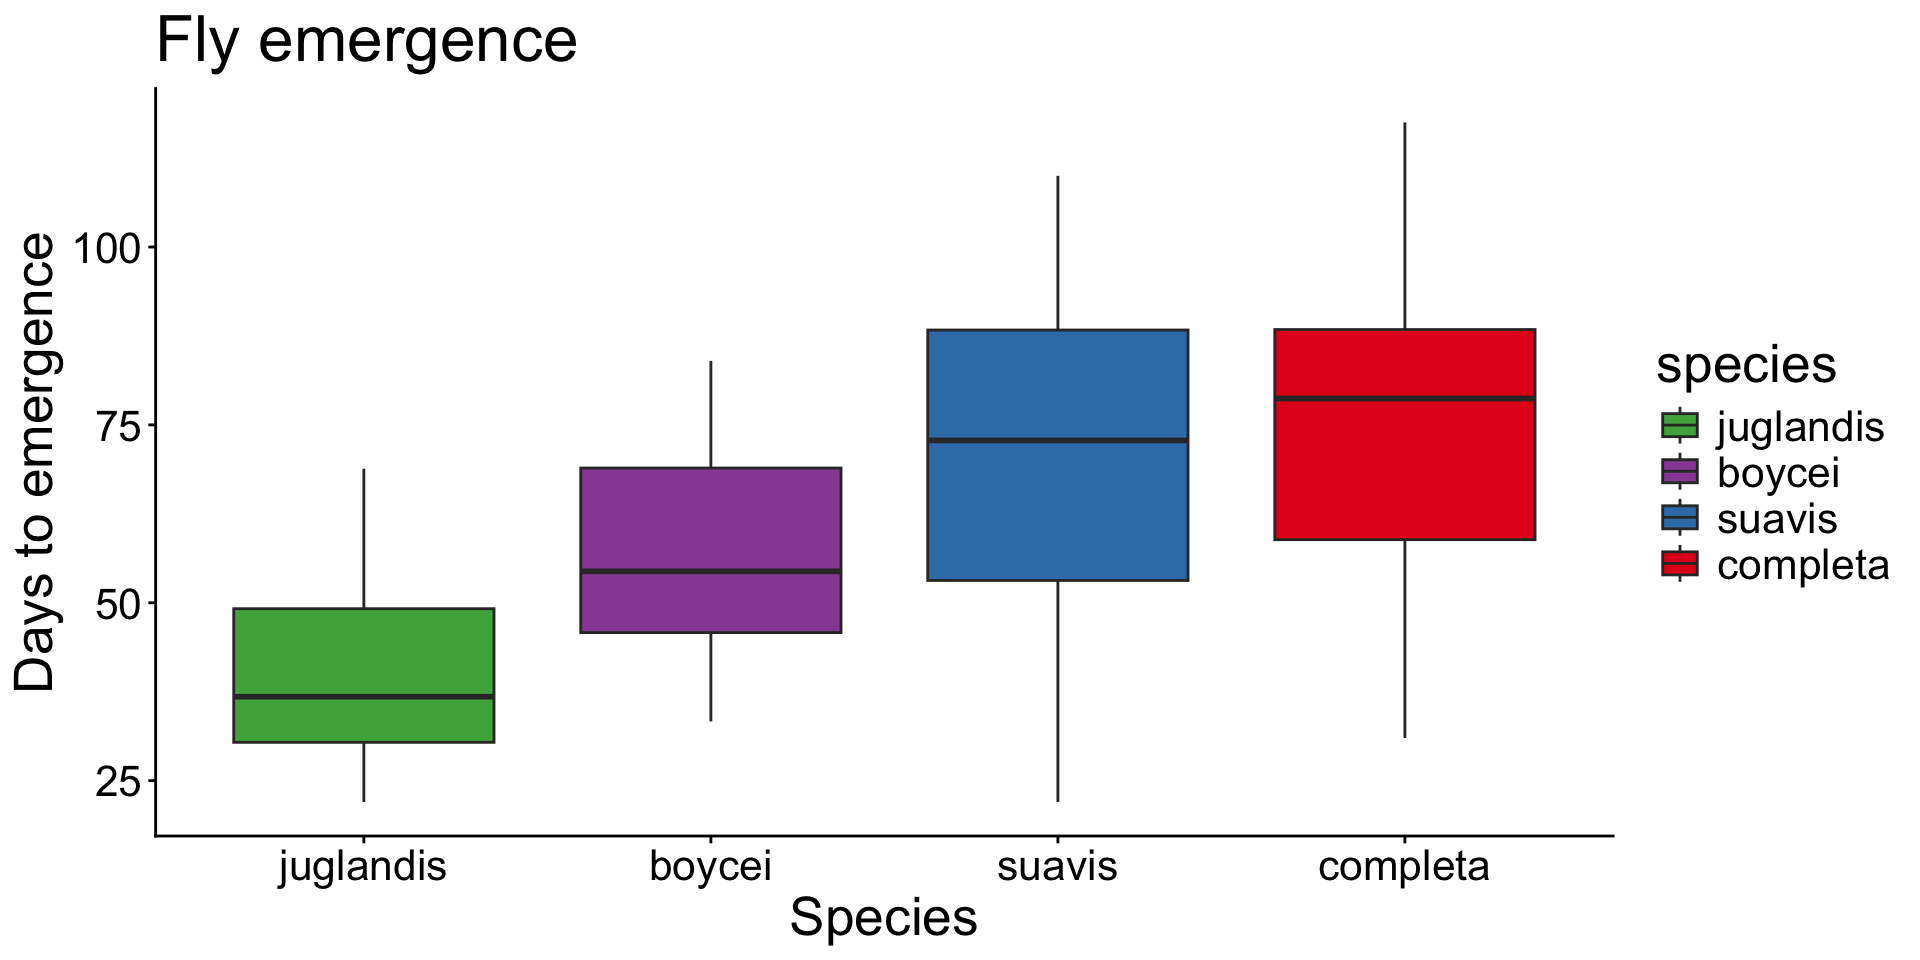
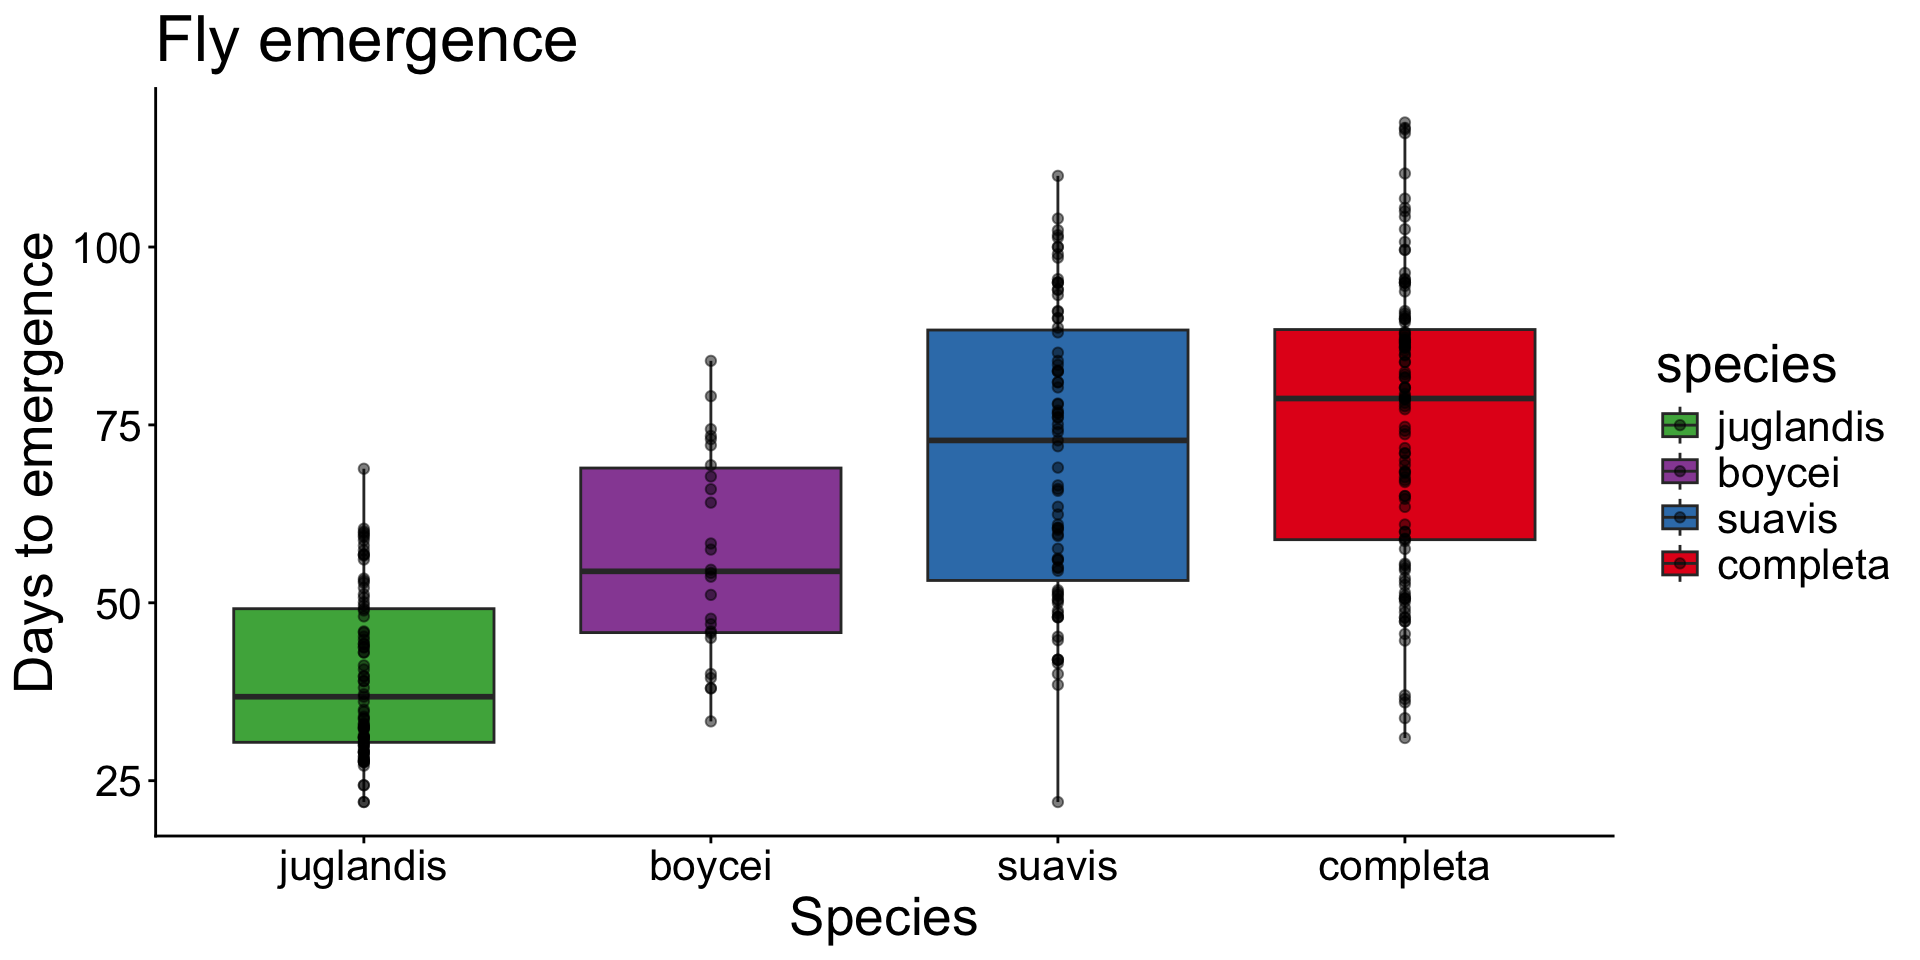
Boxplots show a summary of the data
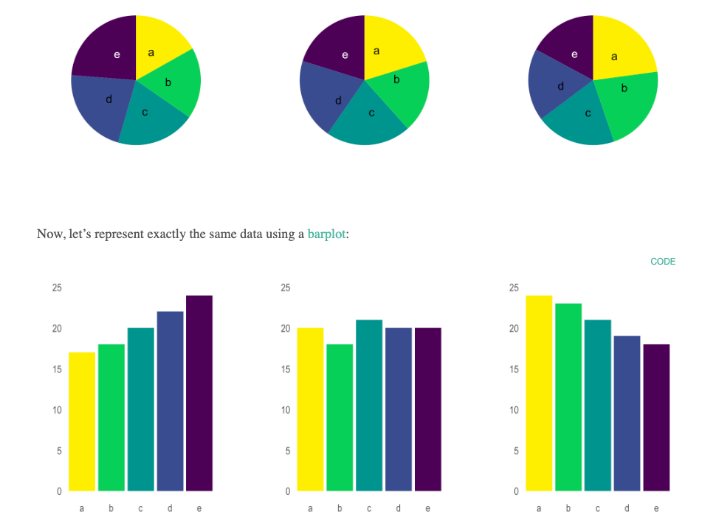
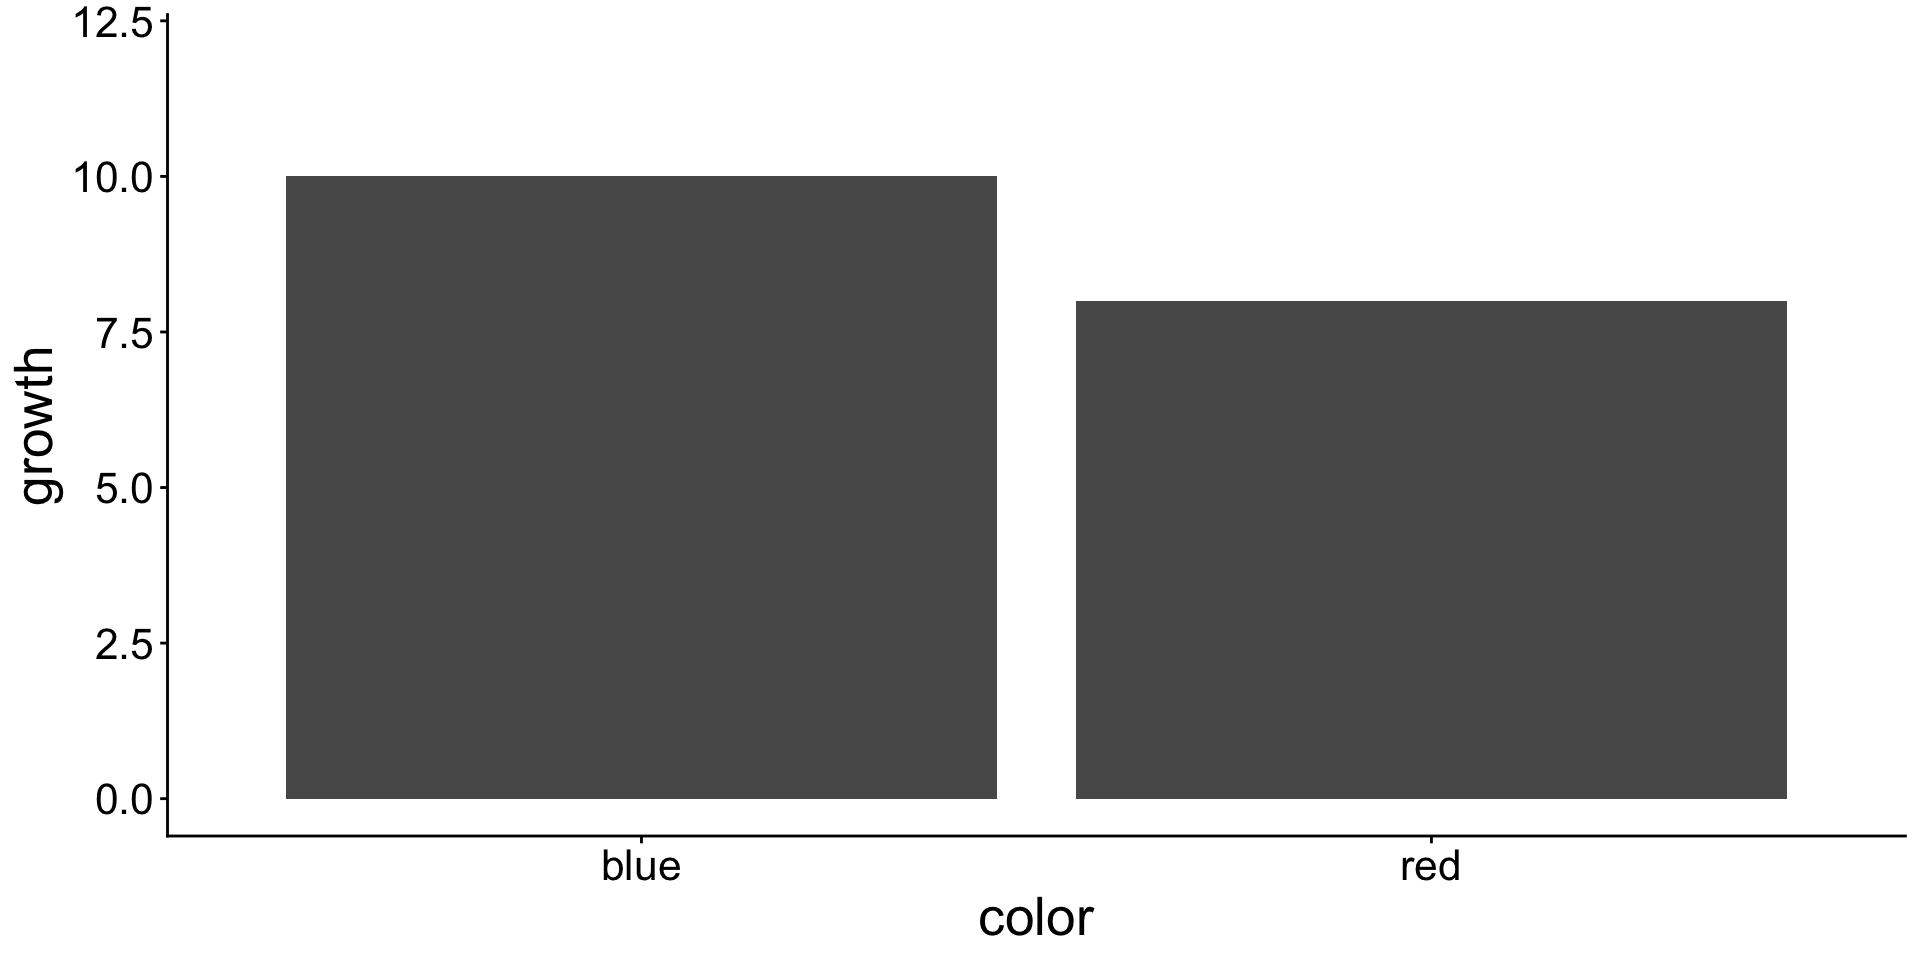
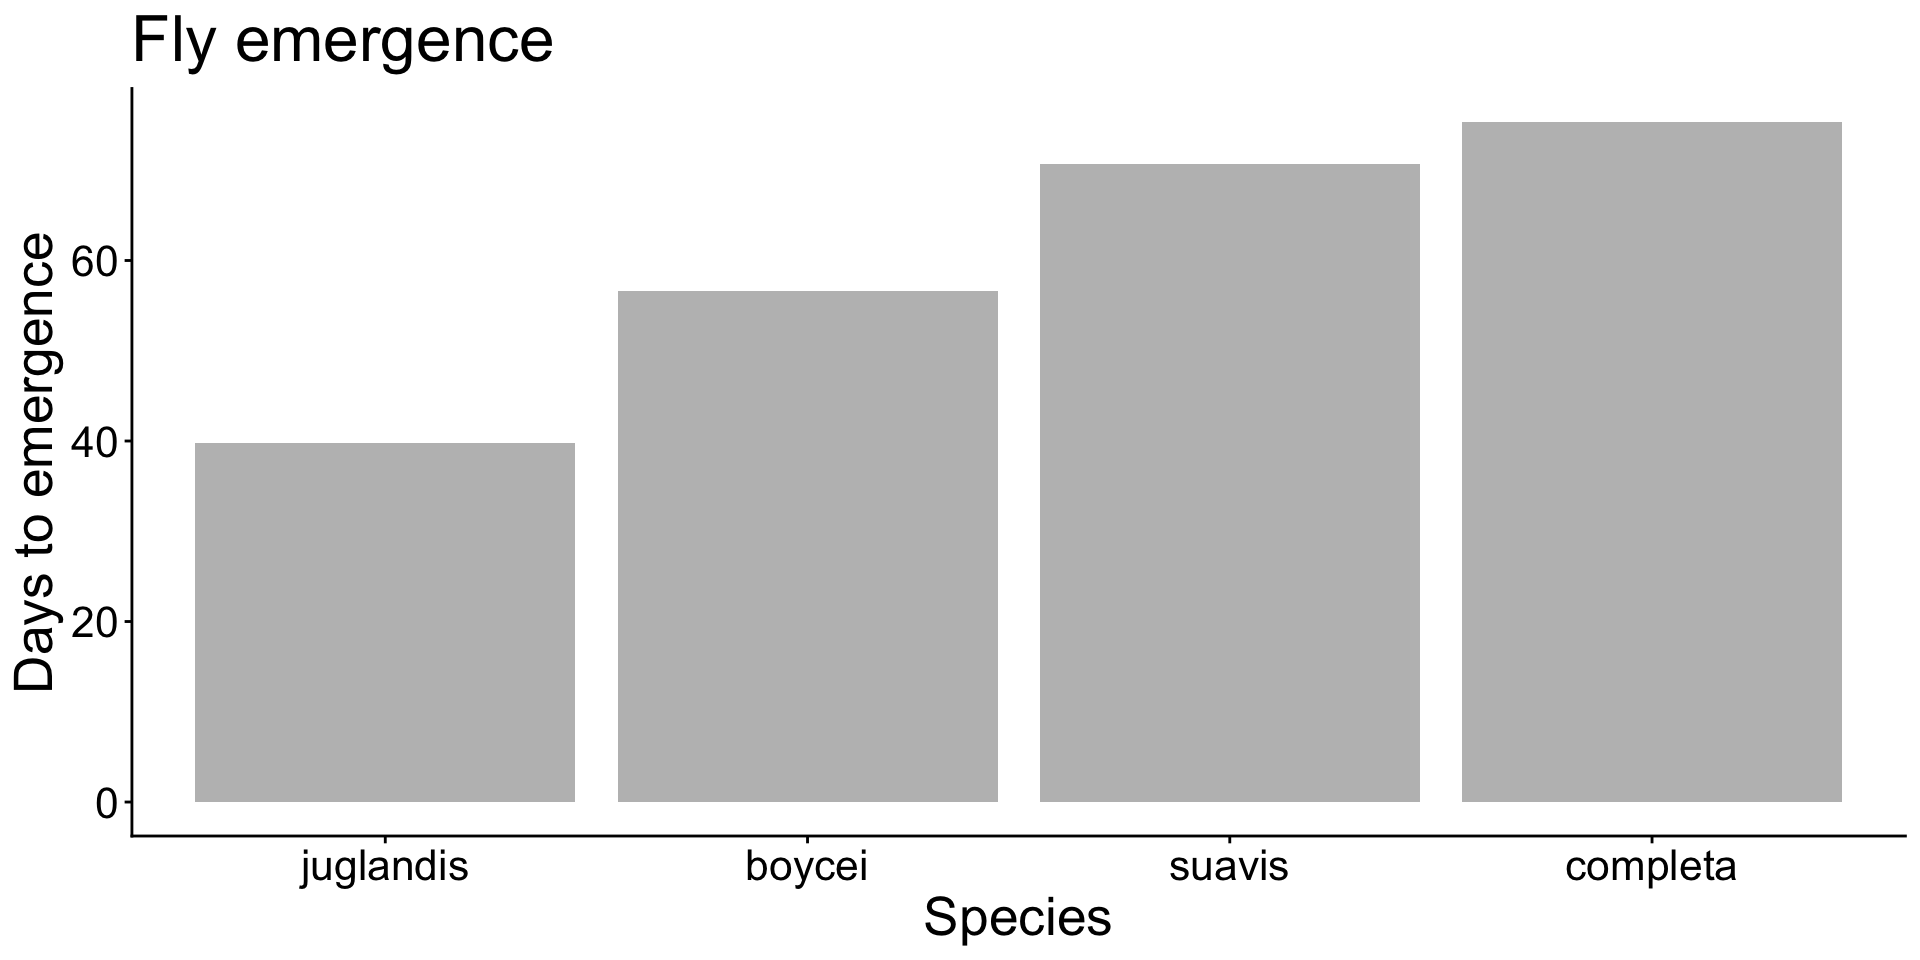
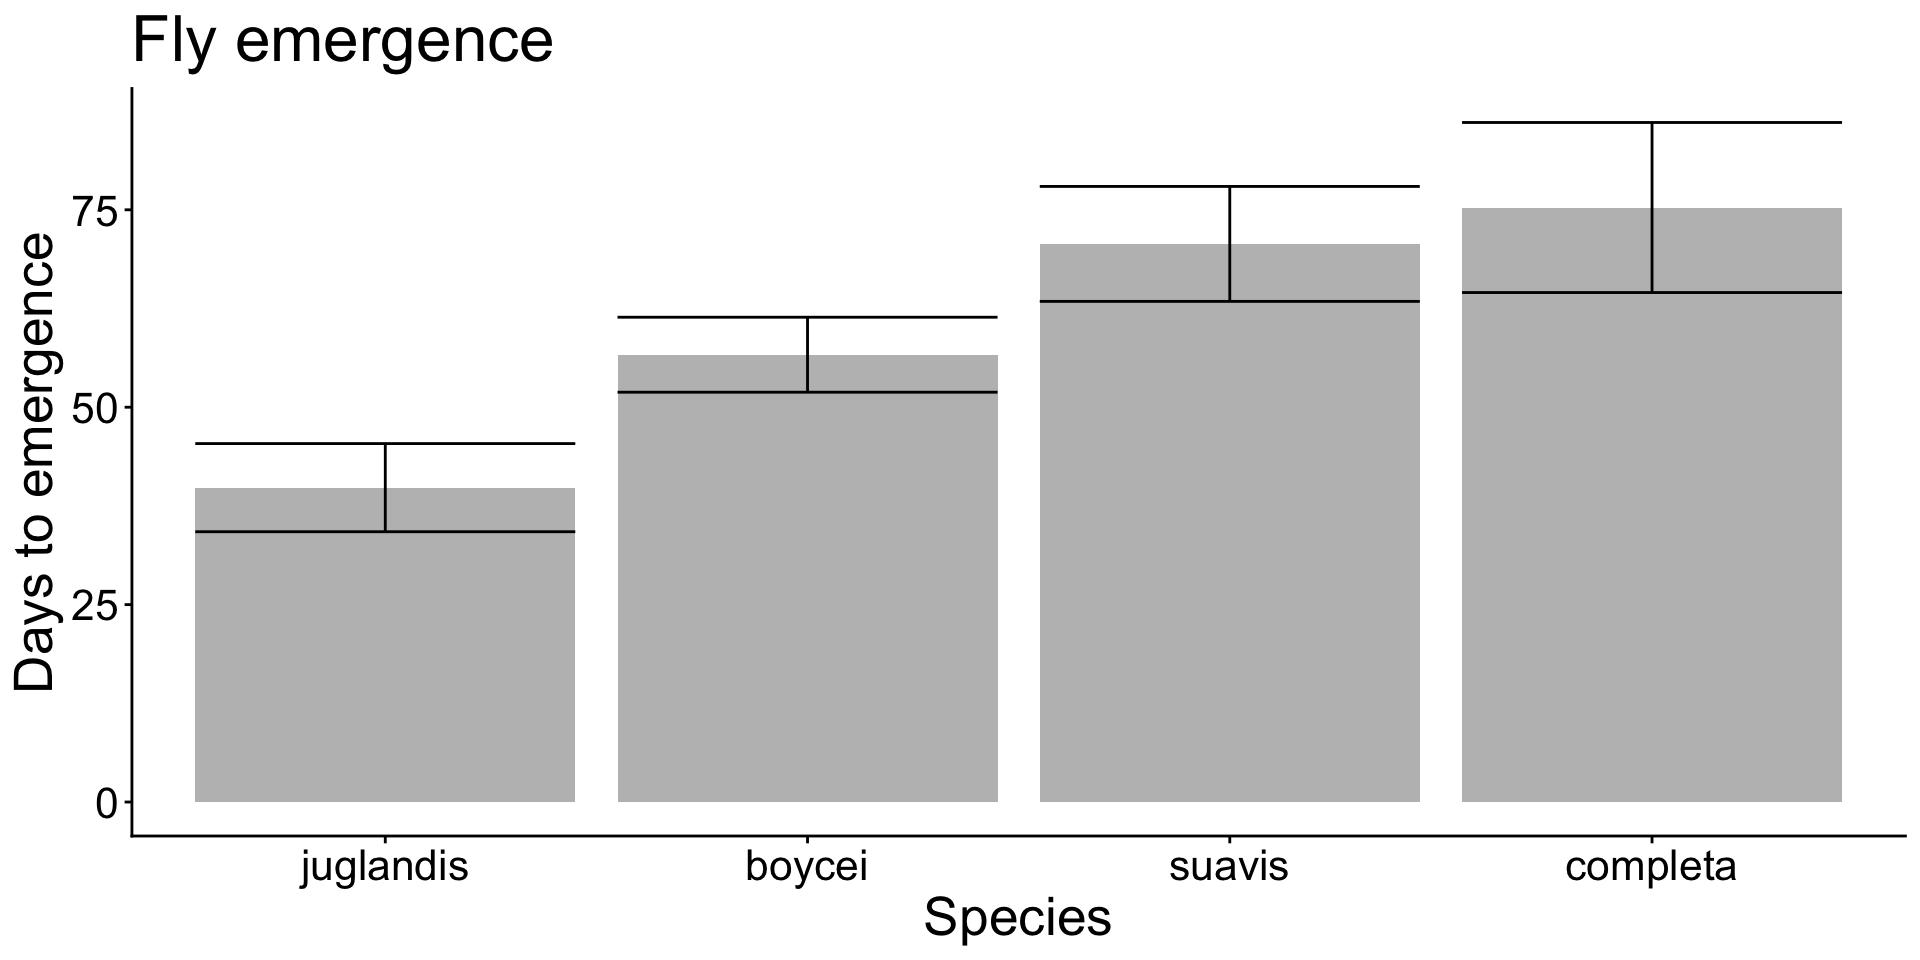
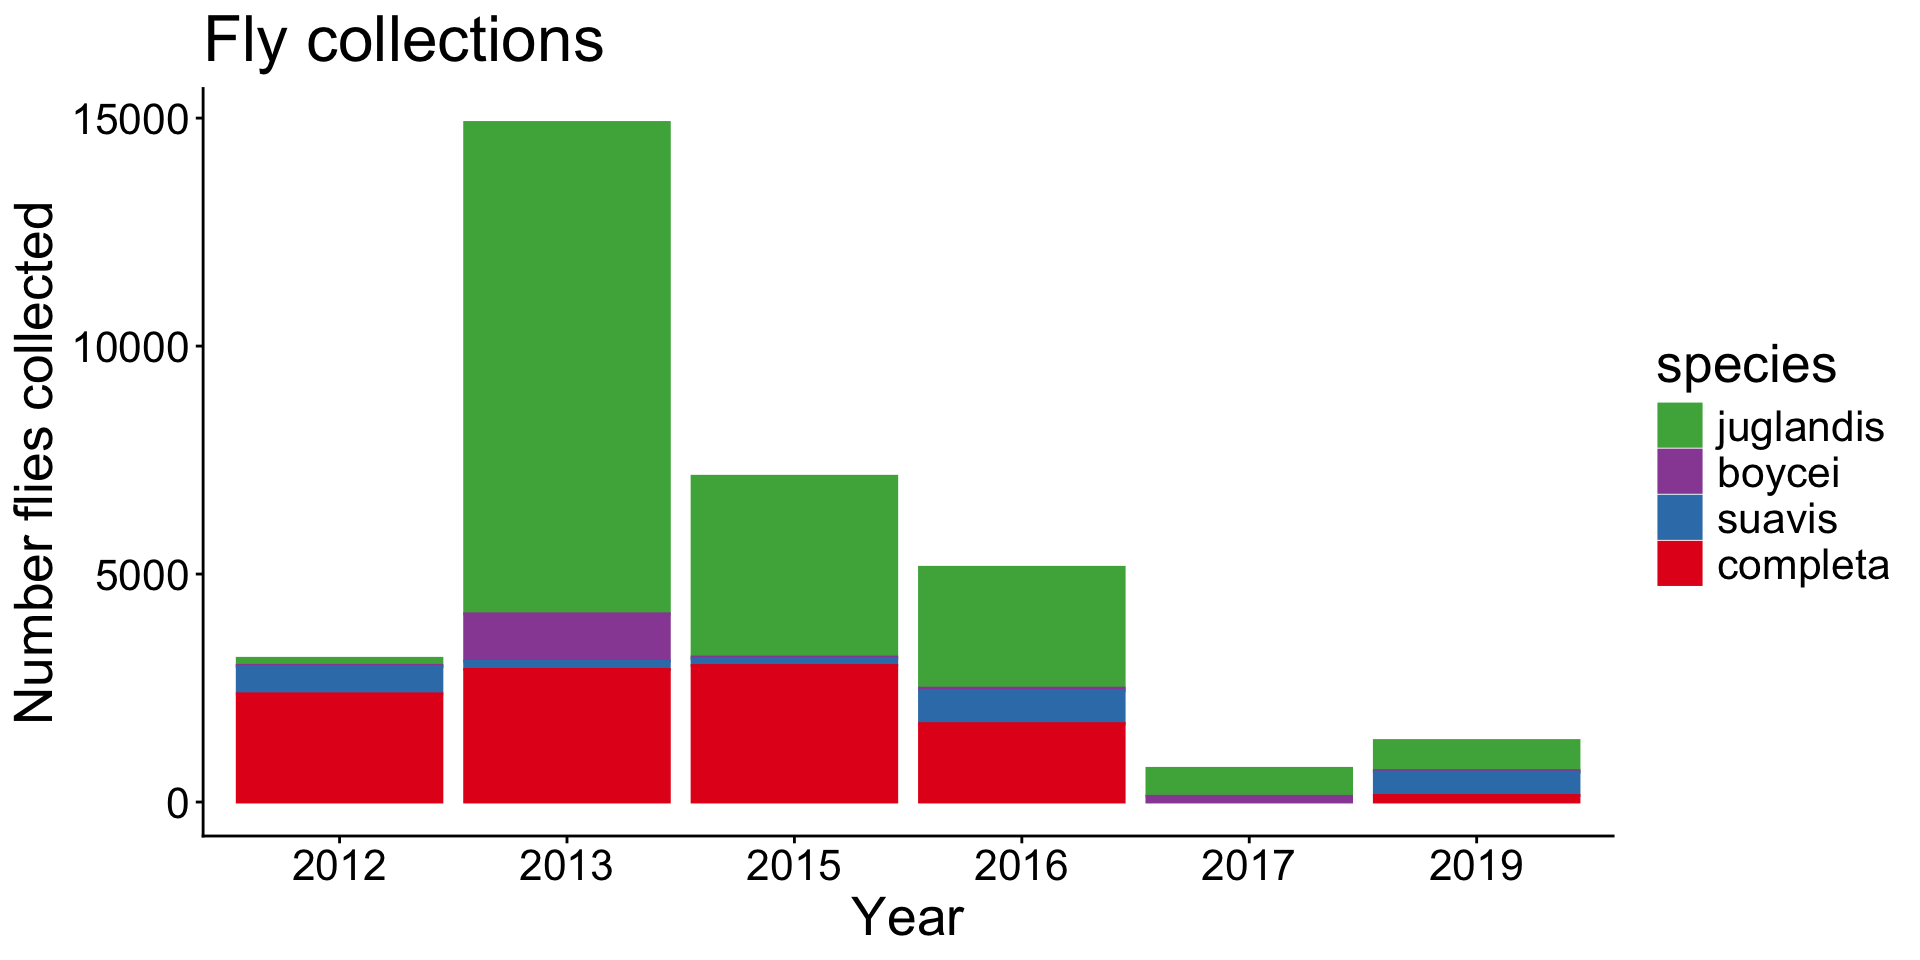
Bar graph show data for a numeric and categorical variable.
- Each bar represents one value.
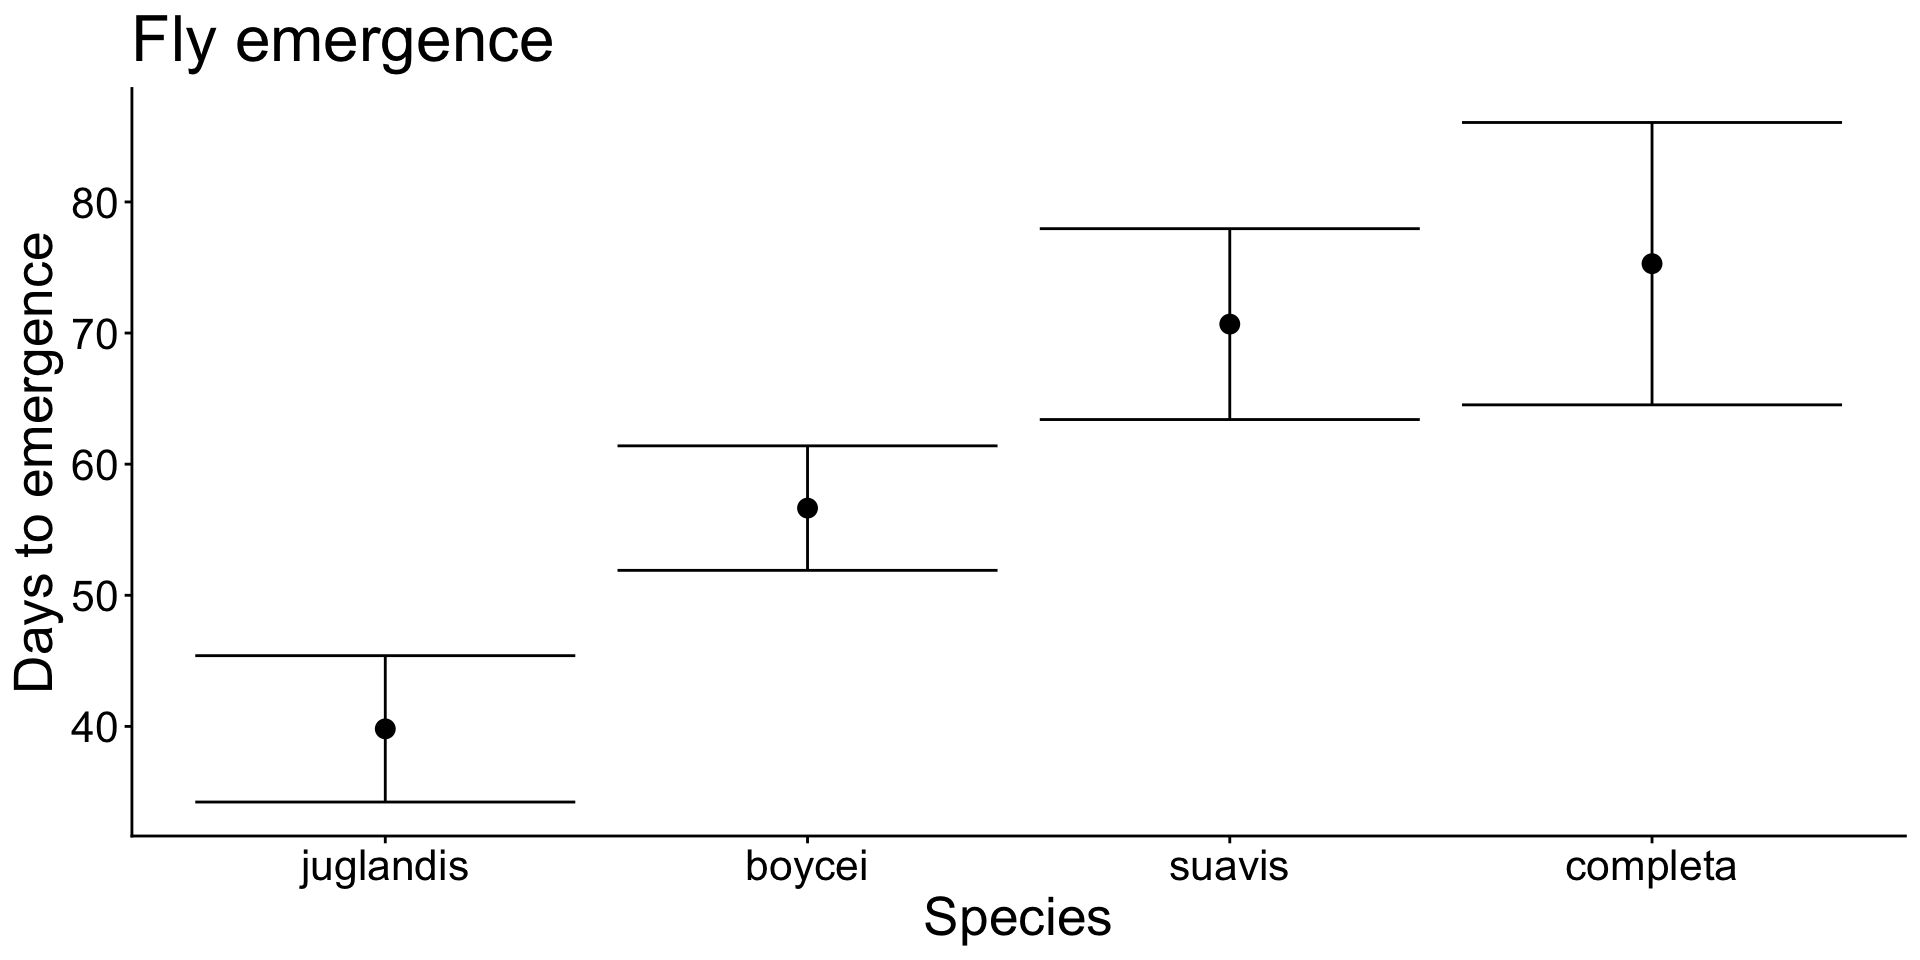
- This is a lot of graph and space for little information
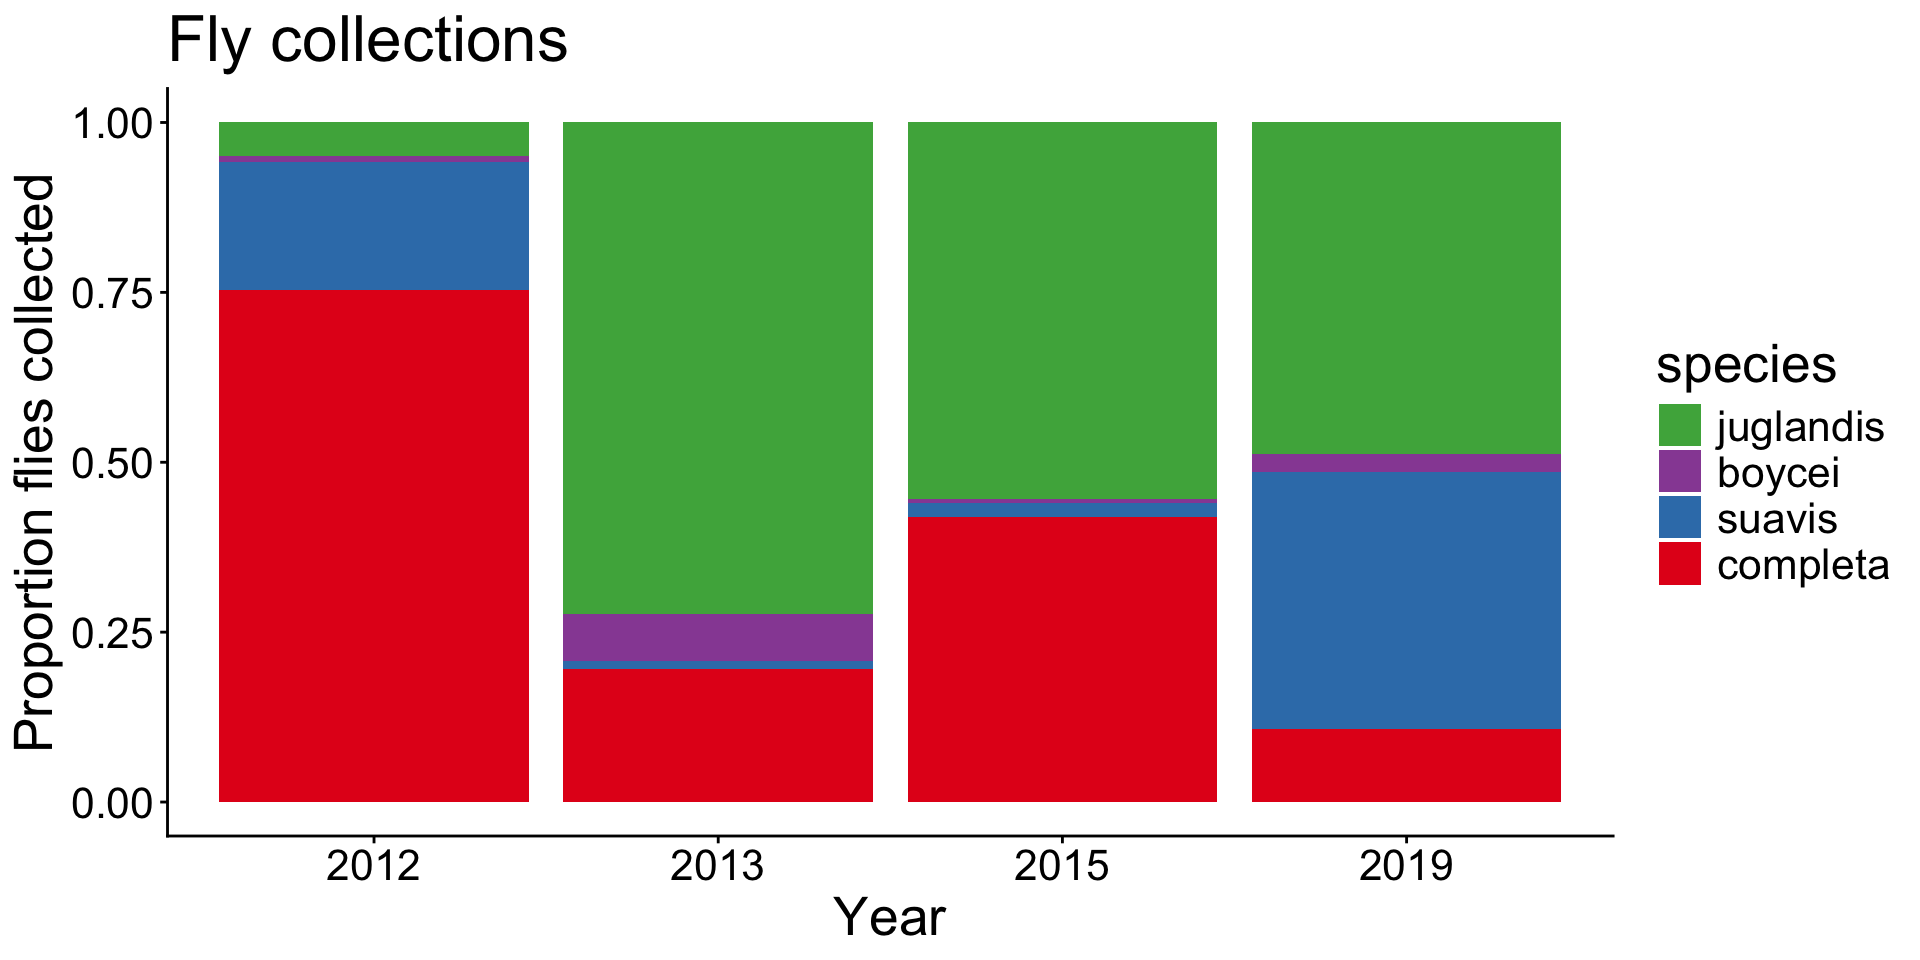
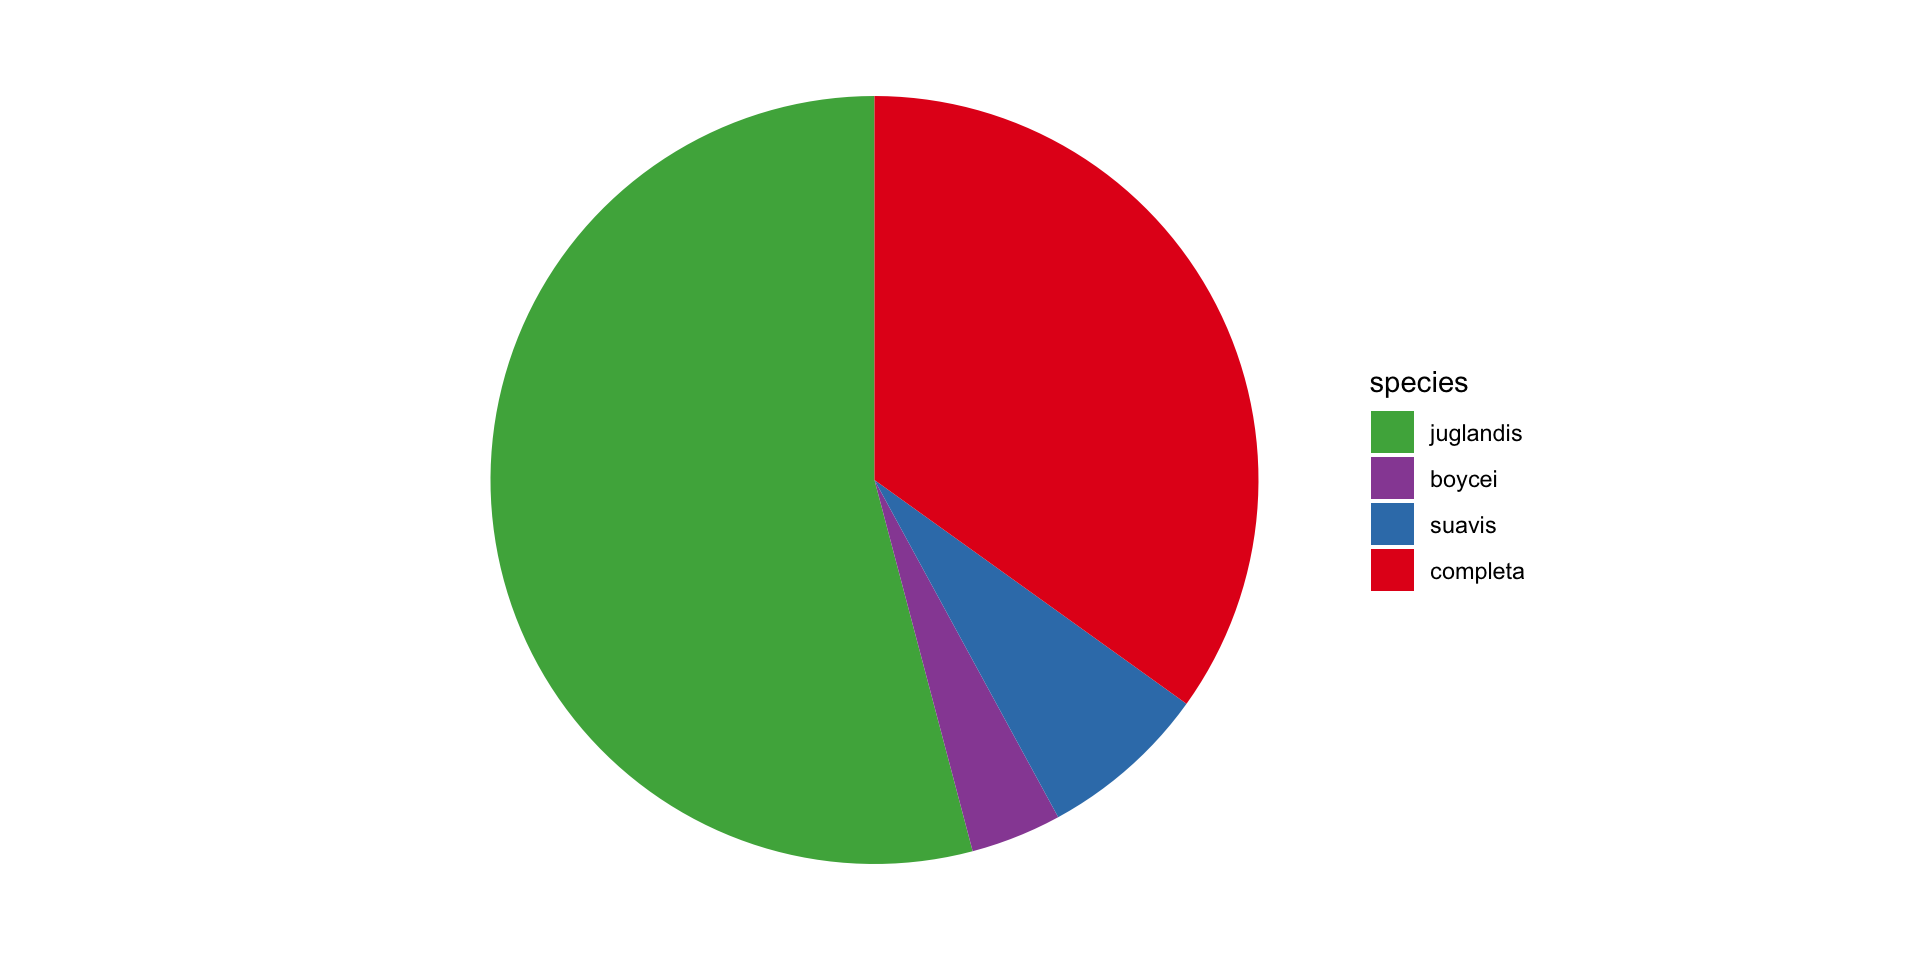
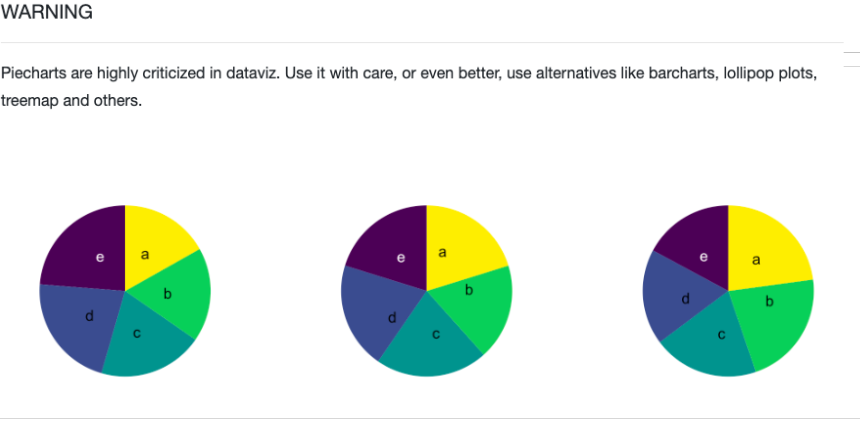
Pie charts show proportions
- Pie charts in general are discouraged.
- It can be hard to infer relationships.