Welcome to BIO 331: Enviornmental Topics and Analysis!
Agenda
- Introduction (5 minutes)
- Course details and syllabus review (15 minutes)
- Class survey (10 minutes)
- Scientific report activity (30 minutes)
- Data analysis activity (45 minutes)
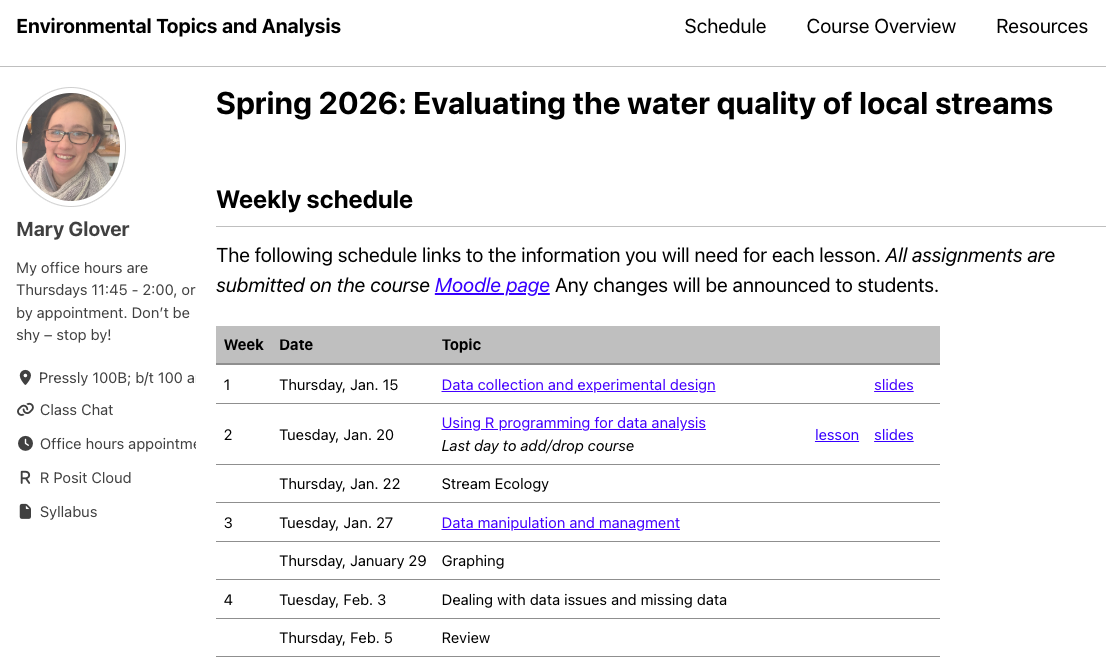
Dr. Mary Glover (she/her)
Email: mmglover@peace.edu. Kindly allow 24 hours for a response.
Office: Pressly 100B (between 100 and 102)
Office hours: Thursdays, 11:45AM - 2:00PM or by appointment on Mondays and Wednesdays. Appointments can be made in Pacer Connect
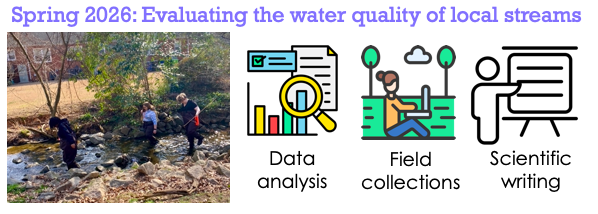
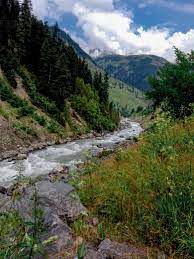
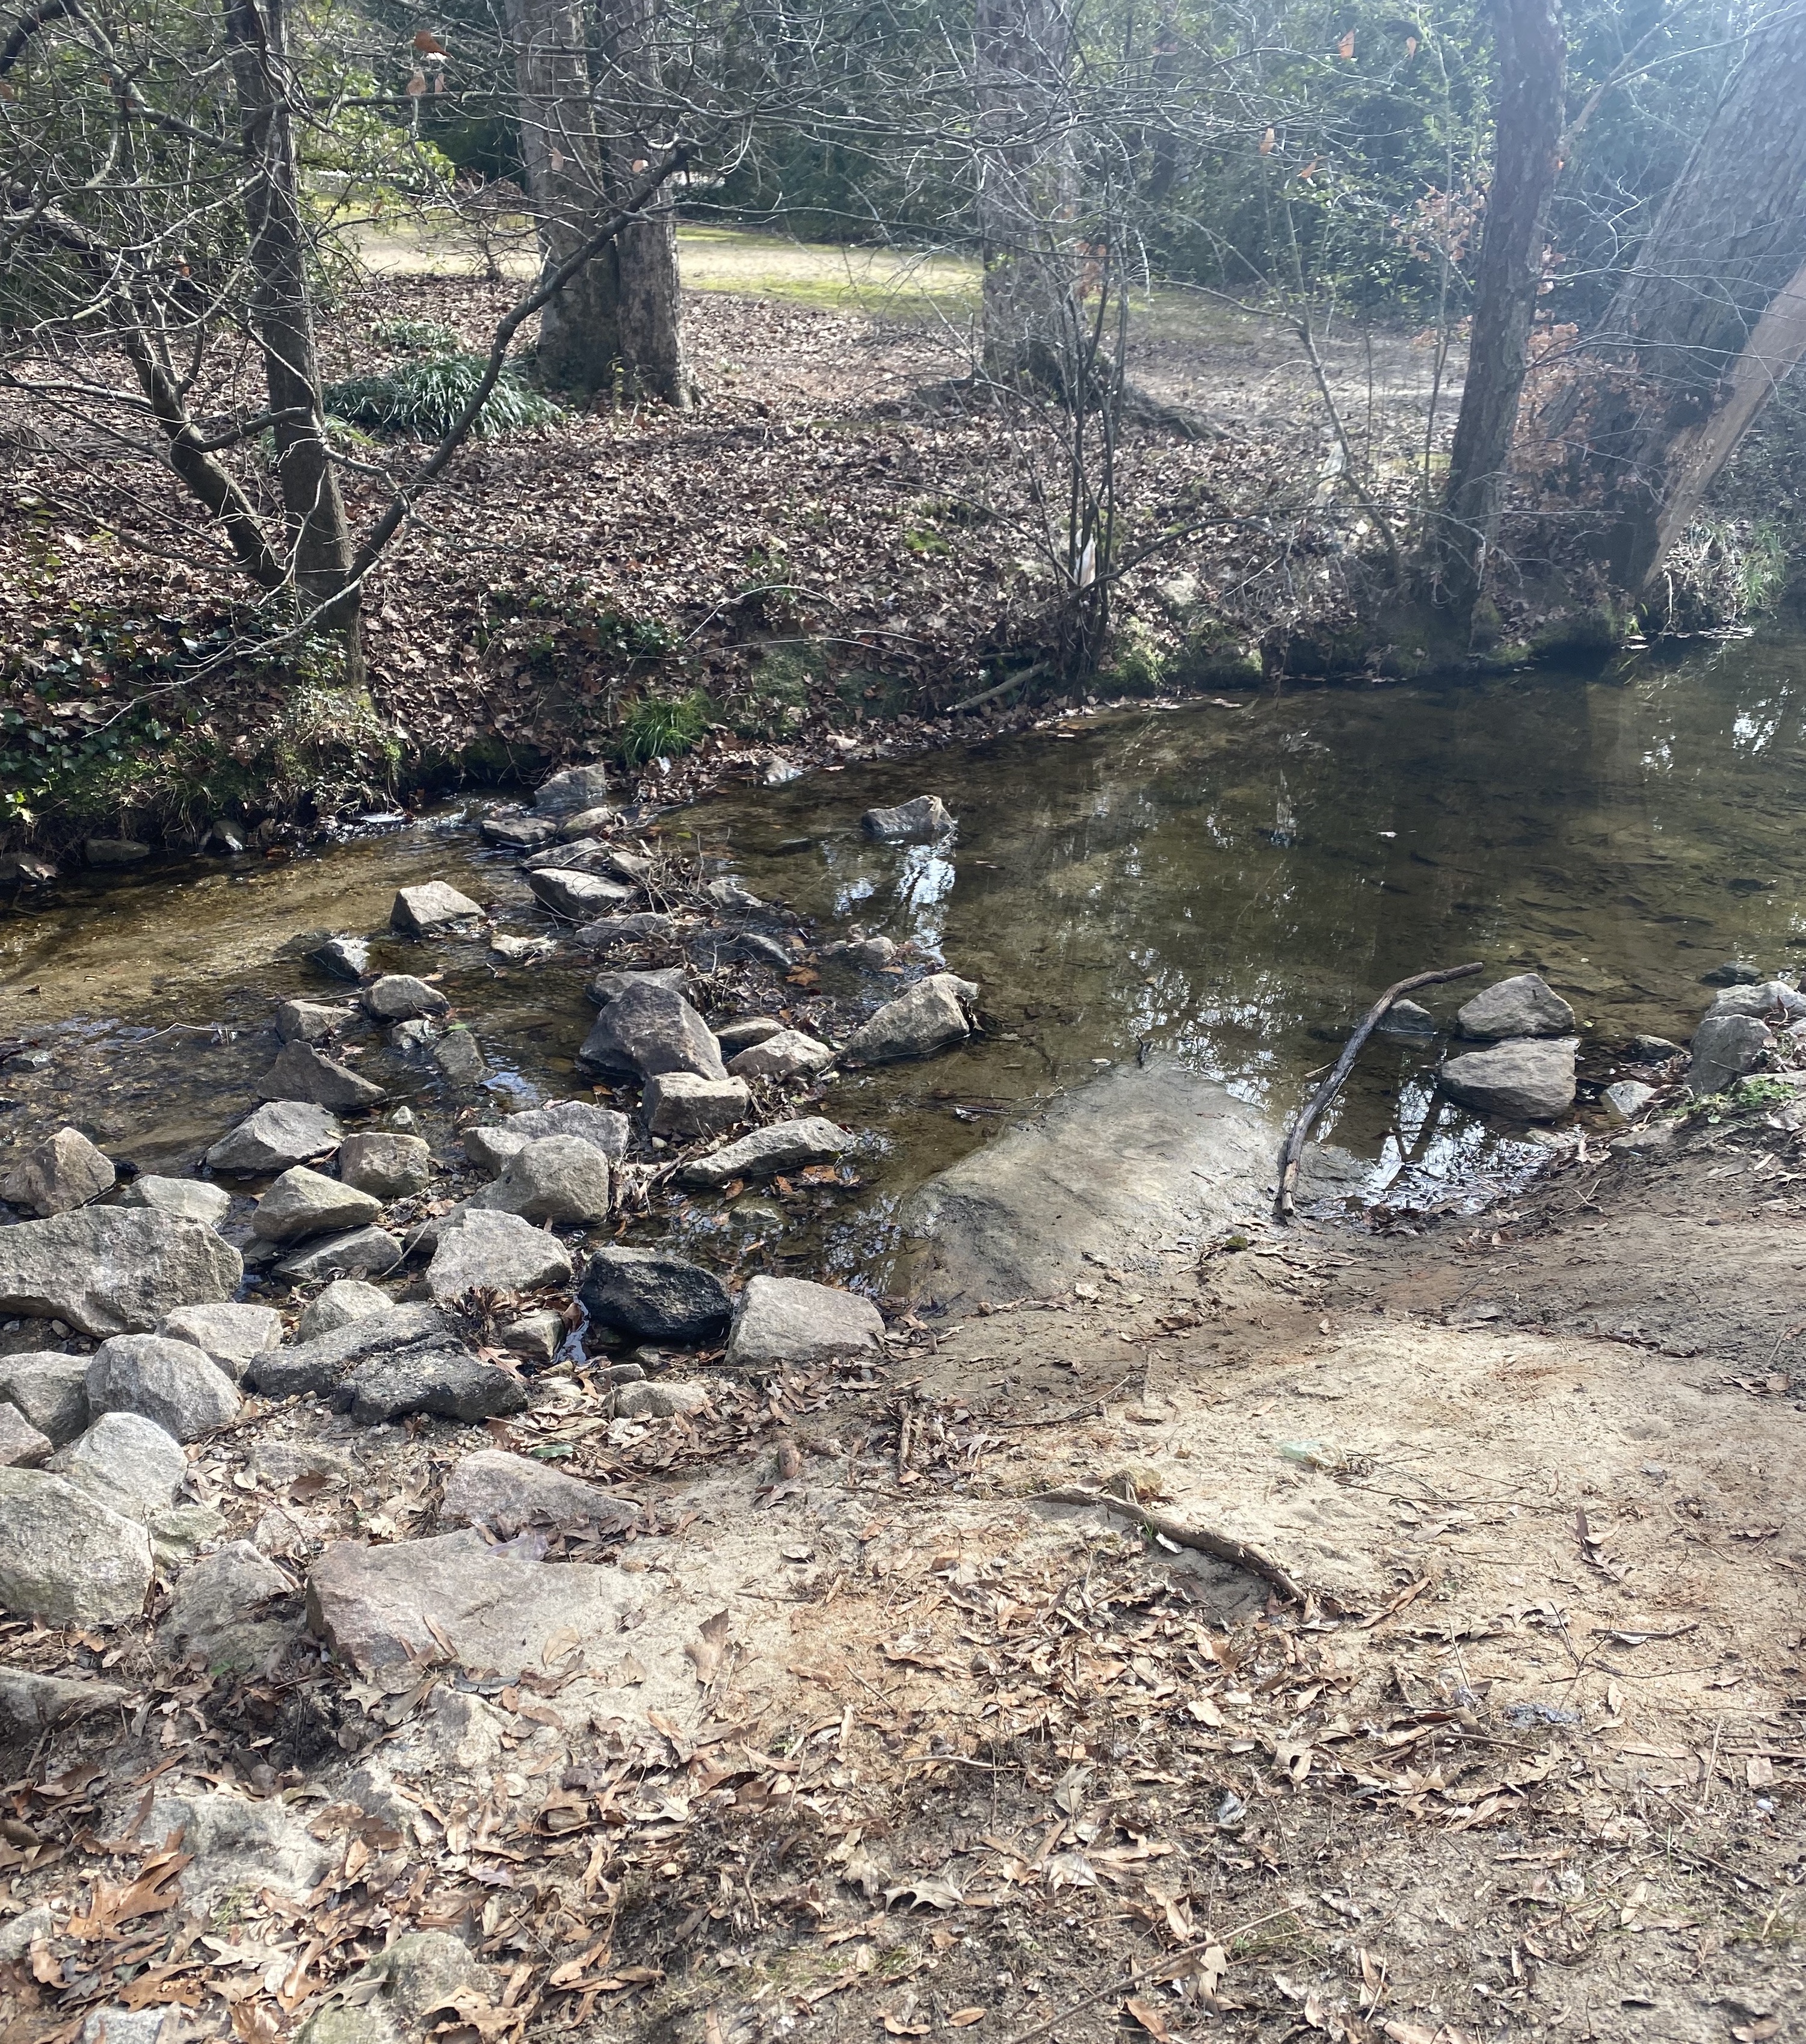
Spring 2026: Evaluating the water quality of local streams
![]()
Why do we care about quality of water?
![]() {fig-align = ‘center’}
{fig-align = ‘center’}
At the end of the semester, students can expect to be able to:
- Analyze data using R programming, including importing and manipulating data, calculating simple statistical measurements, and producing graphs.
- Evaluate water quality using field and lab tests.
- Communicate original research findings to a variety of audiences.
Learning objectives
Analyze data in R
- Manipulate data into a format that can be analyzed
- Calculate summary statistics
- Determine the best type of graph to display data and plot figures
- Test hypotheses with simple statistical tests
- Interpret results and form conclusions.
Learning objectives
Communicate research and findings
- Communicate results to a scientific audience in written and spoken format
- Communicate results to broad, non-scientific audiences.
- Design a scientific presentation summarizing the overall class research project.
Learning objectives
Evaluate water quality
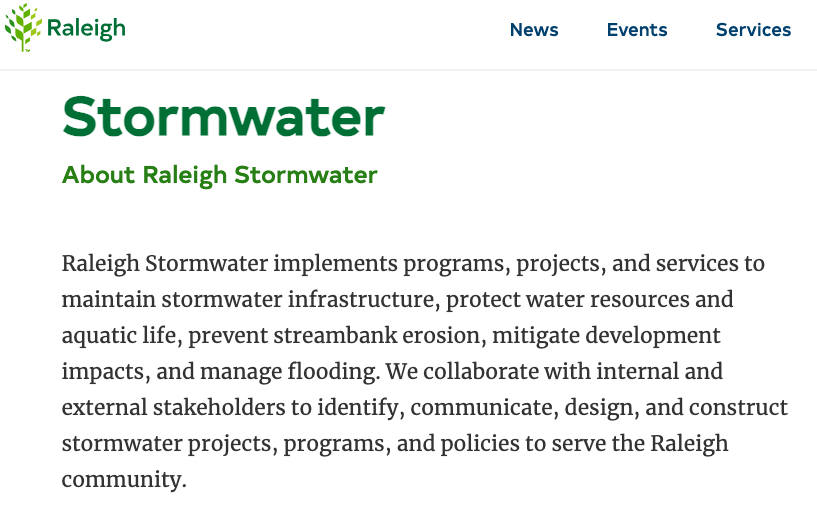
- Describe human activities that impact water quality and evaluate human impact of waterways in Raleigh.
- Measure stream quality through physical, chemical, and biological metrics, using field and lab tests
- Interpret data to evaluate overall water quality in local streams.
City of Raleigh
![]()
Assignments are submitted on Moodle
Google Chat Workspace
![]()
We will use the course chat workspace for questions and help during class. This is a great place to share code when needed.
Homework: Make a post in the class google chat.
Posit Cloud
![]()
We will complete coding exercise on the website posit Cloud. You will receive a link to our class workspace soon!
Homework: Make a Posit Cloud Account
Google Docs and Slides
For writing assignments, students must complete work in a shared google document or google slideshow. Many of the writing assignments will be worked on throughout the semester. This will help emphasize the writing process.
Homework: Make a shared google document to complete the scientific writing assignments.
Course Components
| Data analysis exams (15% + 15%) |
30% |
| Assignments (coding exercises and scientific writing) |
25% |
| Field data collection |
5% |
| Final poster presentation |
25% |
| Showcase presentation |
5% |
| Participation |
10% |
| Total |
100% |
AI is not allowed in this course
![]()
Participation
Students are expected to attend class and actively participate!
Late policy
- Previous coding exercises must be submitted before grading subsequent coding assignments
- All assignments must be completed before the next exam to be graded.
- All writing drafts of showcase presentation and poster presentation must be submitted on time to receive credit
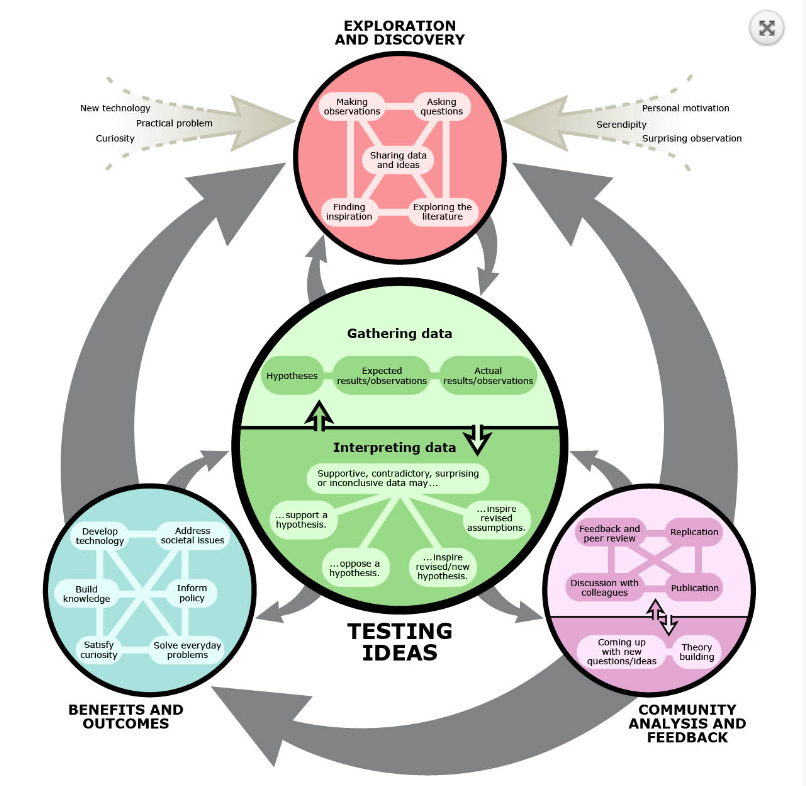
What is science and the scientific method?
- “Hypothesis testing”
- Scientific inquiry uses well-established methods to test hypotheses.
- A hypothesis is a proposed explanation for a natural phenomenon.
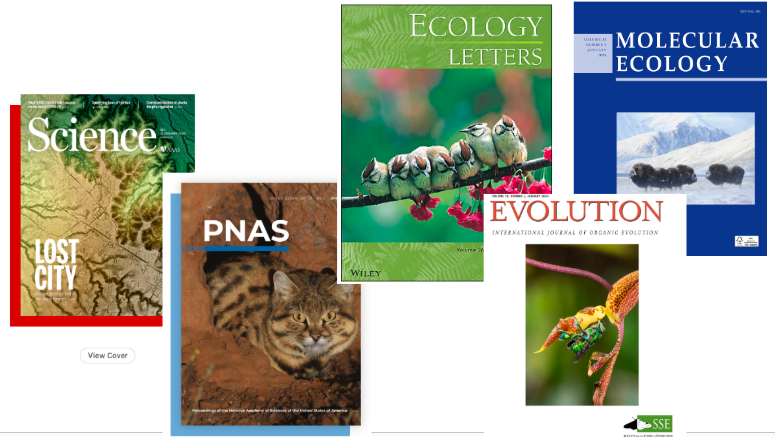
Scientific articles
![]()
Scientific articles have a predictable format
- Abstract
- Introduction
- Methods
- Results
- Discussion
- References
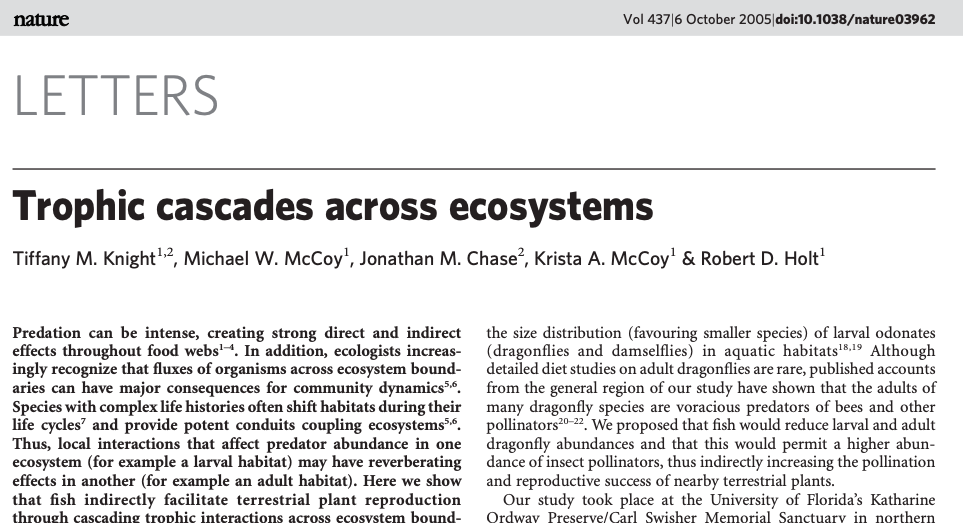
Read the abstract
![]()
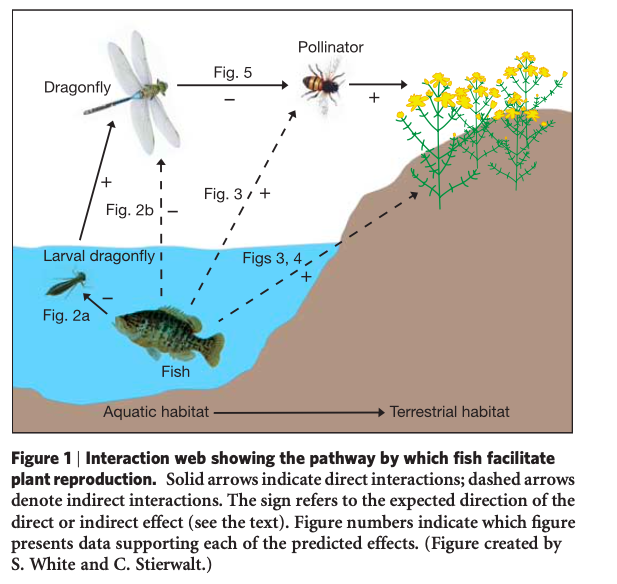
Question: Do species interactions cross ecosystems
![]()
Prediction
“We proposed that fish would reduce larval and adult dragonfly abundances and that this would permit a higher abundance of insect pollinators, thus indirectly increasing the pollination and reproductive success of nearby terrestrial plants.”
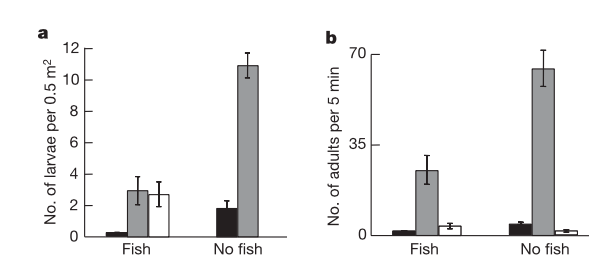
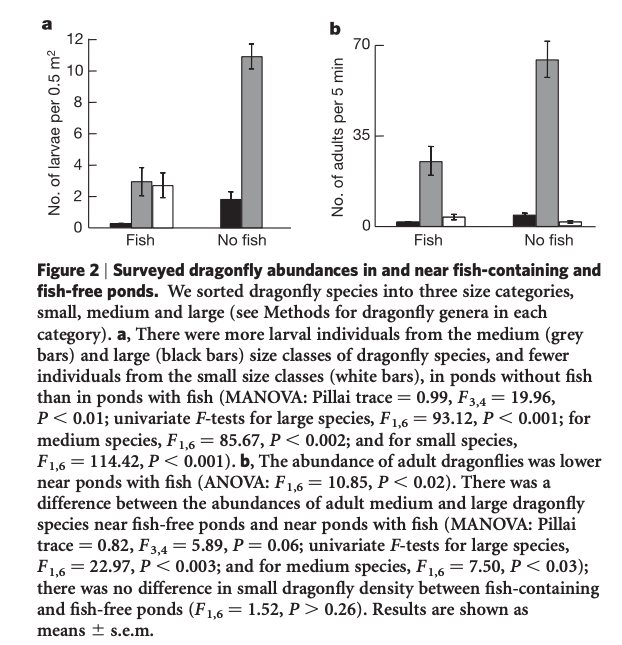
How do fish affect dragonflies?
- The study was done using 8 ponds at a study site in Florida
- 4 of the ponds had fish, 4 did not have fish
- To measure the abundance of dragonfly larva, they put metal boxes in each of the ponds at 5 random locations to collect and count dragonflies. They also used sweep nets in the ponds.
- To measure the abundance of dragonfly adults, had one observer count the number of dragonflies they saw in a 5 minute window. They made 2 counts at each pond.
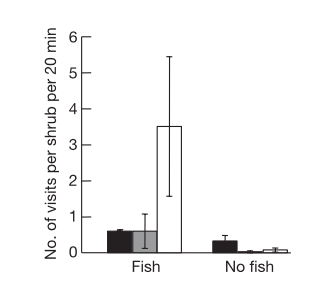
Measuring pollinators
- At each of the ponds, they measured the number of pollinators on St. John’s Wort shrubs.
- They watched each shrub for 20 minutes and counted the number of pollinator visits.
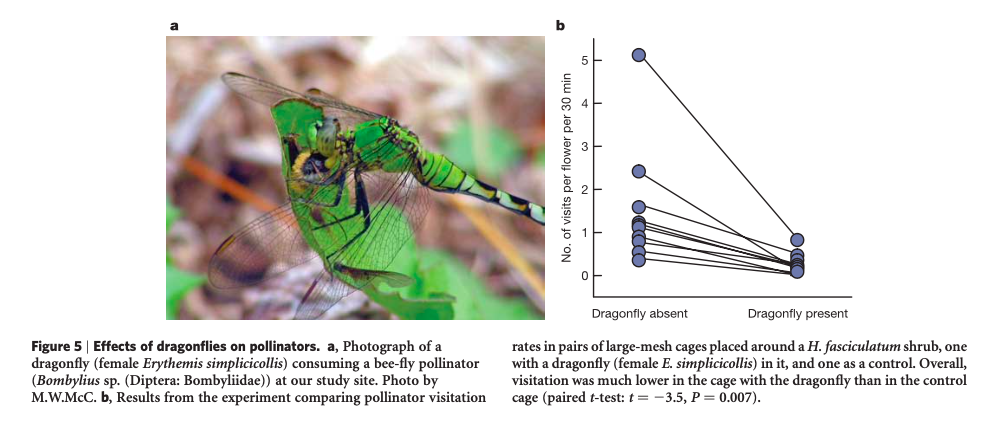
Dragonfly predation
- They measured the direct effect of dragonflies on the pollinators.
- They built cages around the shrubs. In some, they added a dragonfly. In some, they did not.
- The dragonflies could not escape, but pollinators could easily enter the cages.
- They counted the number of pollinator visits in each cage over 30 minutes
Do their results support their prediction?
What does this mean?
“Understanding interactions across ecosystem types may be crucial for gauging the effects of anthropogenic environmental change. Deliberate introductions of fish by humans are ubiquitous through- out the world (for example for recreation or pest control)26,27. Our results reveal that such introductions might have cascading effects on adjacent terrestrial ecosystems.”
What is data?
- Data are a collection of facts
- Data can be quantitative or qualitative
Two types of scientific tests
Experimental studies: A treatment is imposed on a group and the response is measured. Something is manipulated.
Observational studies: Groups are observed and measured by not manipulated.
Replication gives more accurate representation of group
Replication gives more accurate representation of group
![]()
Scientific variables
The dependent variable is the variable that is being measured or affected by the treatment
The independent variable is the variable that is changed or manipulated in the experiment.
Class Activity: Paper Airplanes!
- In 2 groups complete the paper airplane activity
For next week:
- Introduce yourself on the class Google Chat
- Make an account on Posit Cloud
- Make shared google document for scientific writing and submit on Moodle
 {fig-align = ‘center’}